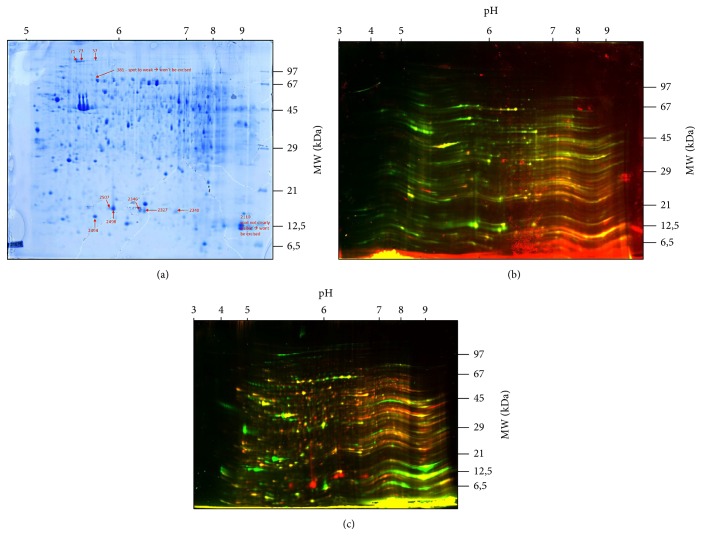
Figure 1.
(a) Preparative 2D-Gel (Coomassie blue) of control and sepsis samples. Threshold of regulation is 2 SD (standard deviation) and t-test value P < 0.01. Spots #381 and #2110 have not been analyzed (Table 2) since they were too weak or not visible for excision. Other spots are marked with arrows and numbers. Alteration of the spots is presented in Table 3. The gel is a sample gel with proteins of the 24 hours' group. (b) Cy3 and Cy5 images of the gels. Cy5: red color = sepsis 24 h group. Cy3: green color = control group. The gel shows proteins of the control group and 24 hours group. (c) Cy3 and Cy5 images of the gels. Cy5: red color = control group. Cy3: green color = 48 h sepsis group. The gel shows proteins of the control group and 48 hours' group.

