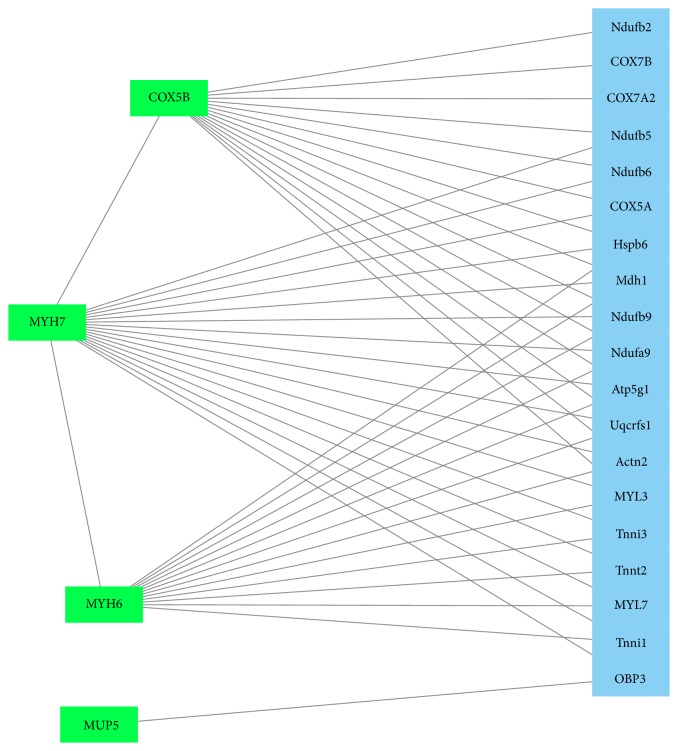
Figure 4.
GeneMANIA network (http://www.genemania.org/; visualization using Cytoscape, http://www.cytoscape.org/) found by search of significantly regulated proteins of the present study (i.e., MYH6, MYH7, COX5B, and MUP5). Proteins were entered to gather interactions. Green squares represent searched proteins and blue squares represent connections found by GeneMANIA. The identified proteins MUP5, COX5B, MYH6, and MYH7 are linked together within this network mainly by Atp5g1, COX5a, and OBP3. The lines show interactions between the nodes/proteins. To generate the network, all significantly altered proteins were used for analysis, that is, pooled data from the 24 and 48 hours' group.

