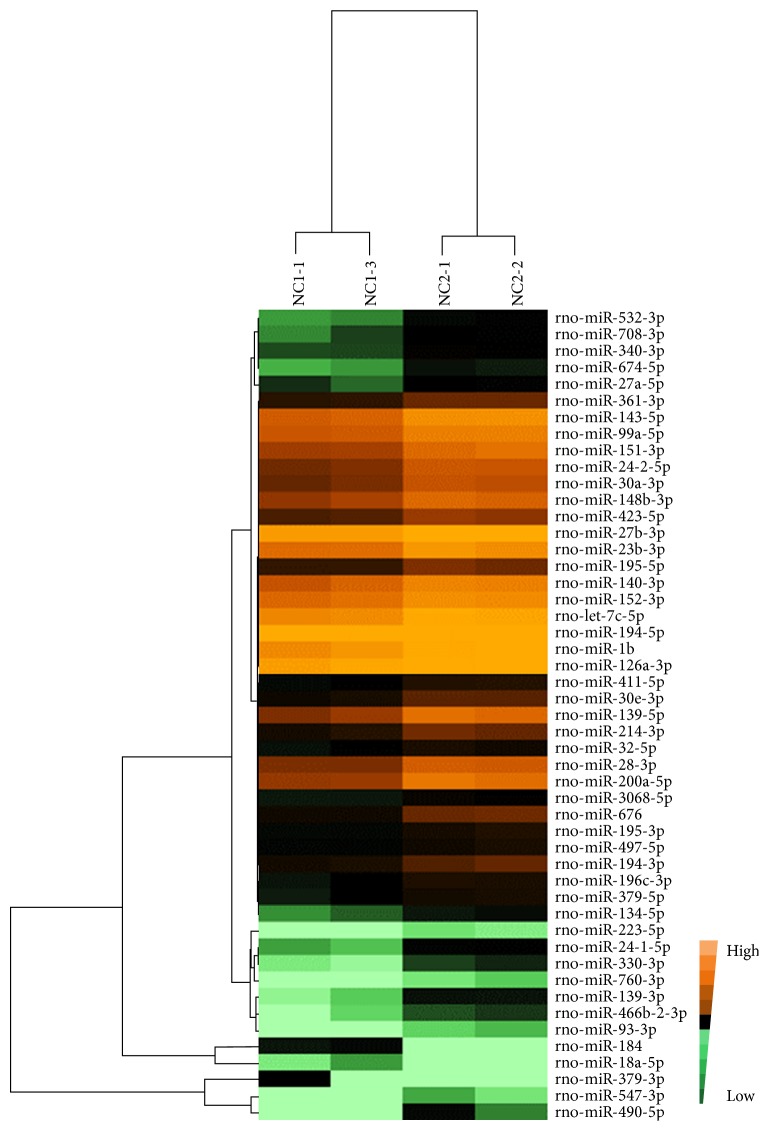
Figure 6.
The differentially expressed miRNA profile of UC versus NC. The bright brown color indicates the highest expression. The expression decreases with the darkening of the brown color. The black color indicates that the expression is 0. A change in color from bright green to dark green indicates a gradual decrease in expression.

