Figure 3.

Change in numerical rating scale (NRS) pain scores between the substantial responder and nonresponder groups during follow-up; ∗P = 0.007, †P < 0.001.

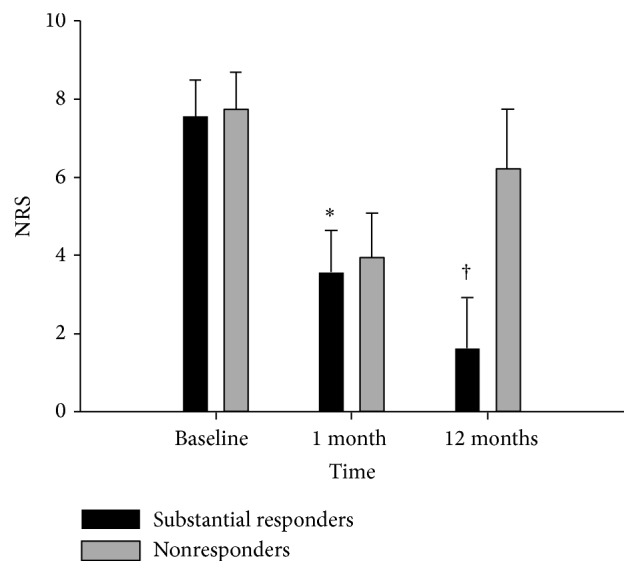
Change in numerical rating scale (NRS) pain scores between the substantial responder and nonresponder groups during follow-up; ∗P = 0.007, †P < 0.001.