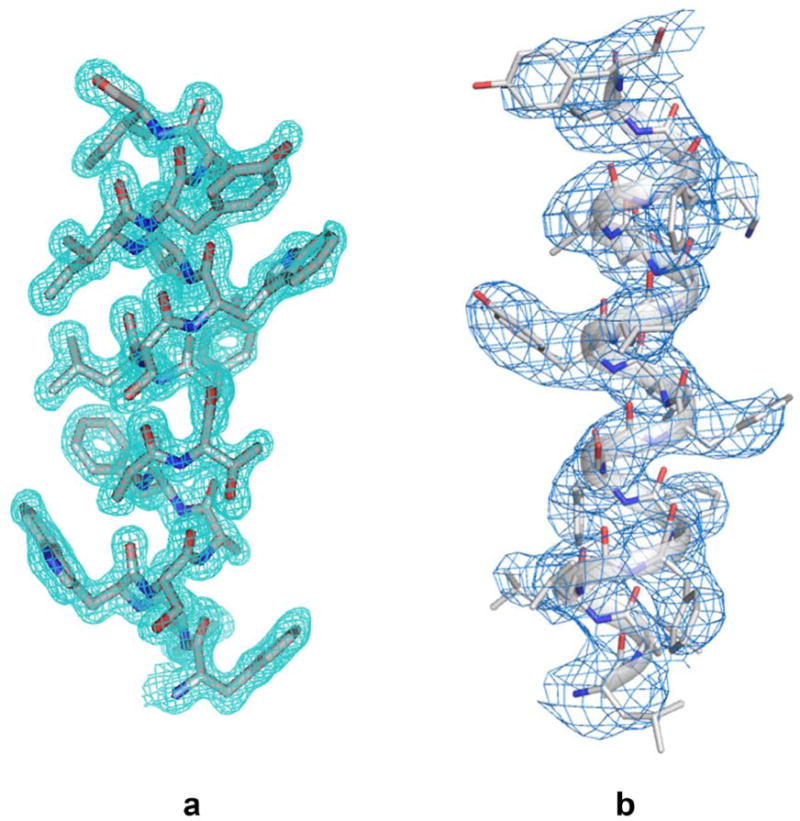
Figure 3.

Density distributions for transmembrane helices obtained by different methods. (a) Helix TM5 (residues F136-I49) from TSPO of Bacillus cereus as determined at 1.7 Å resolution from an apo type 2 crystal grown in LCP30. Reproduced from Figure S2 of Ref. 30 with permission by Science. (b) Helix TM3 (residues L171-Y189) of presenilin from the cryo-EM structure of human γ-secretase at 3.4 Å resolution28. Adapted from Extended Data Figure 2 of Ref. 28 with permission by Nature.
