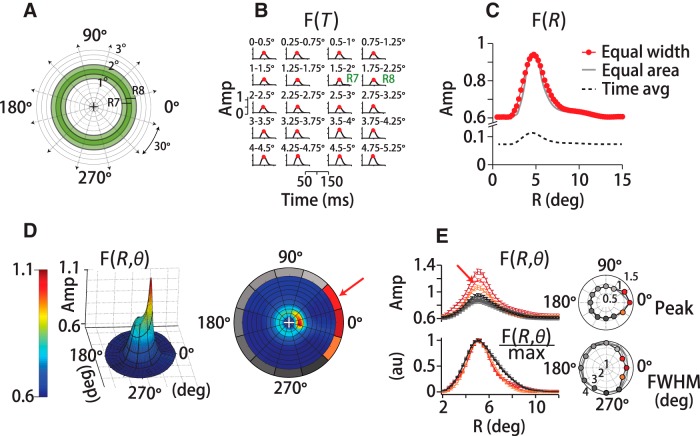
Figure 2.
Spatiotemporal filter for motion integration. A, We defined the motion stimulus on a polar grid centered on instantaneous eye position (+), dividing visual space into 59 concentric overlapping annuli of 0.5° (visual degrees of spatial arc) width that span 15° of eccentricity. Green rings (R7, R8) exemplify the overlap in adjacent annuli. We further subdivided space into 12, 30° pie-slice segments. B, At each spatial location, we computed a temporal filter between eye and dot-averaged motion direction, here shown only for eccentricities up to 5.25° of 15°. Red circles indicate the peak of the temporal filter, F(R = Ri, T)max. Each temporal filter represents a unitless weight corresponding to a dot's contribution to eye direction based on its position and the time delay. The peak temporal filter amplitudes (Amp) sweep out the spatial filter based on motion eccentricity, F(R), in C, red trace. Reconfiguring the annuli to equalize the number of dots in each grid region does not change the form of the spatial filter (gray trace). Defining F(R) by the time-averaged amplitude rather than the peak reduces the scale, but does not change the filter's form (dotted black trace). D, 3D spatial filter, F(R, θ, T), shows a pronounced directional anisotropy, with high amplitudes in front, below and above the eye. Color and height indicate the relative contribution to pursuit of different portions of the visual field in a 3D projection (left) and a top-down view (right). The red arrow points to the same example segment (15–45 degrees of spatial arc) in D and E. The gray-red colors of the polar plot's outer sections (right) represent the relative spatial filter amplitudes in each angular segment. The contribution of many segments was nearly identical, reflected in the similarity in outer-section shading. E, Top left, Set of spatial filters from each directional segment from one experiment (M1), colors correspond to the right panel in D. Amplitudes are high along the direction of motion (red-orange shades), but similar otherwise (gray shades). Top right polar plot, Peak amplitude versus direction segment for three humans and two monkeys. The traces overlap. Bottom left, Normalizing by the peak amplitude illustrates that the filter is narrowing in segments where amplitudes are high. Bottom right polar plot, Spatial filter FWHM for five subjects (black, gray lines).

