Figure 3.
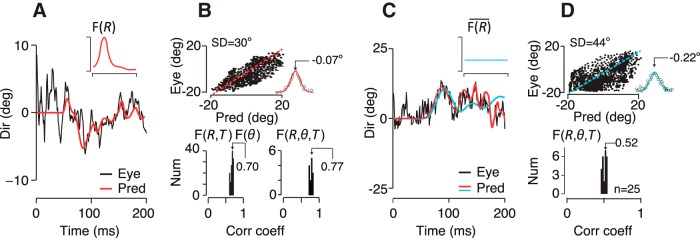
Predictive power of the spatiotemporal filter for pursuit. A, Predicted eye direction over time with respect to pursuit onset for an example trial (red) compared with the monkeys' actual eye direction (black). The inset shows the eccentricity dependence of the spatial filter, but the full 3D filter, F(R, θ, T) was used for the reconstruction (black trace). B, Although we calculated the filter by relating fluctuations in stimulus direction with eye direction around the mean, we found that the same filter form is able to predict the time averaged eye direction throughout the dataset (top) The predictive errors have a Gaussian distribution and near-zero bias (inset) indicative of a noise process. The dashed red line has a slope of 1. Bottom, Population data showing the distribution of correlation coefficients between predicted and actual eye direction over time across many datasets and subjects. The bottom left panel shows the correlation coefficients using F(R, T) ⊗ F(θ) for experiments with 5–30°-diameter stimuli. The right panel shows just the 30°-diameter experiments from which we derived F(R, θ, T). C, Eye direction prediction is poor with a flat spatial filter, F(R) (cyan line, inset) despite pooling motion over all dots to estimate the mean direction. Predicted (cyan) and measured eye direction (black) across time for an example trial are shown with the actual pursuit filter's prediction in red. D, Top, Predicted versus actual eye direction as in B. The distribution of residuals shows that the filter produces both systematic and random prediction errors. Bottom, as in B. The flat filter accounts for only 27% of the variance of eye direction over time compared with 59% for the filter itself.

