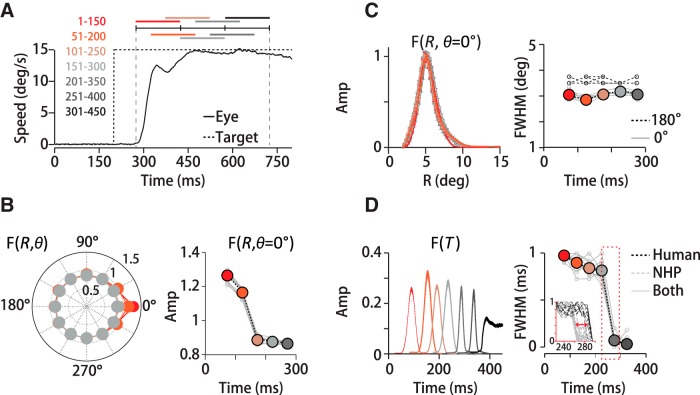
Figure 7.
Dynamics of spatial and temporal motion integration. A, Target (dotted line) and eye speed (solid line) over time. Diagram indicates the overlapping 150 ms time windows in which we computed filters. B, Left, Polar plot of the directional dependence of the peak filter amplitude in the time windows defined in A for M1. The directional bias is strongest early in pursuit (red-orange symbols), diminishing to uniform weighting at 175 ms (red-gray symbols). Right, Time evolution of peak filter amplitude in the θ = 0° segment in front of the eye. Colored circles indicate mean values, thin gray lines data from 12 datasets (M1–M2, H1–H3). C, Filter widths for the spatial direction segment in front of the eye, F(R, θ = 0°), do not change over the time period. Left, Example traces (M1). Right, Population mean spatial filter FWHM (n = 12 datasets, M1–M2, H1–H3) as a function of time window center (colored circles). Error SDs are smaller than the symbol size. Gray lines represent individual datasets. D, Left, Example of the time evolution of the temporal filter, F(T) (M1). Right, Filter duration (FWHM; n = 12 datasets, M1–M2, H1–H3) is stable over the first 225 ms of pursuit, but narrows in later time windows. Error SDs are smaller than symbol size. Inset expands the area surrounded by the red dotted line. Upping the time resolution to 10 ms from 50 ms intervals reveals a species difference in the time at which the temporal filters narrow (red arrow). Temporal filter duration (FWHM) drops at 260 ± 6 ms (SD) (n = 8 datasets, M1–M2) in monkeys (gray dotted lines) and 295 ± 8 ms (SD) (n = 4 datasets, H1–H3) in humans (black dotted lines).

