
Figure 4. Retrograde labelling with Fluorogold.
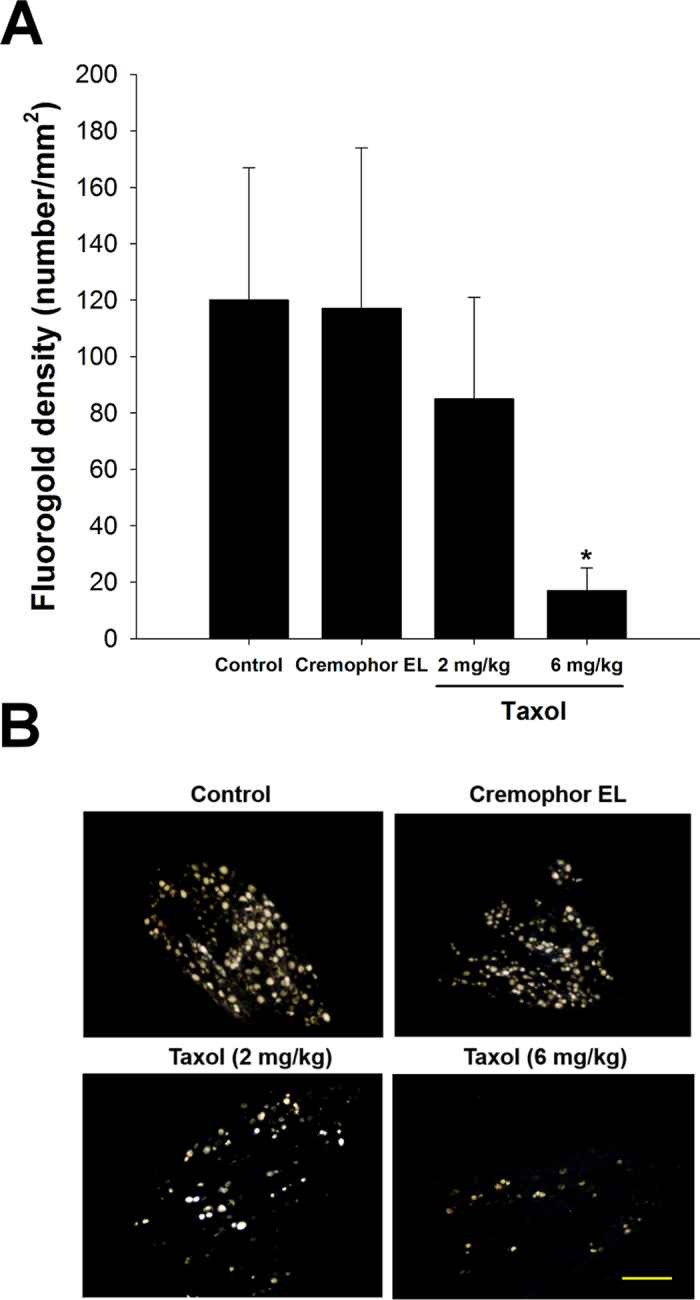
(A) The number of Fluorogold-labelled cell in DRGs was dramatically decreased in taxol-treated animals. (B) Representative images of the retrograde axonal tracing with Fluorogold. The values represent means ± standard deviation (SD) for 10 rats for each group. *P < 0.05, compared to control and Cremophor EL groups. Scale bar = 250 μm.