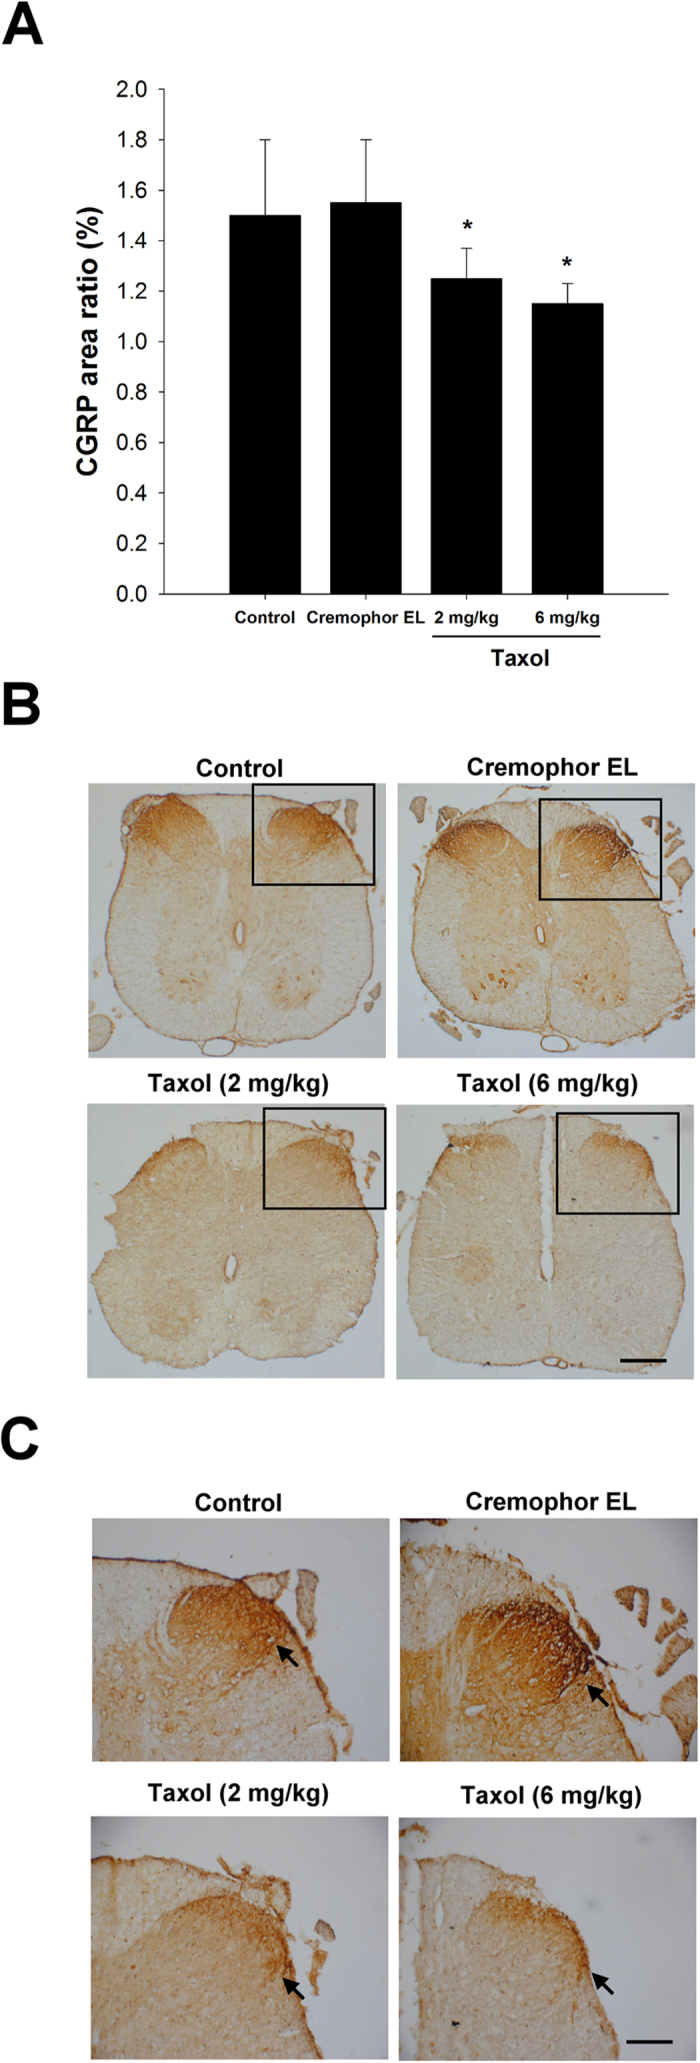
Figure 8. Effects of taxol on calcitonin gene-related peptide (CGRP) expression in rats after nerve injury surgery.

(A) Quantitation for the ratio of CGRP expression area. (B) Representative histological micrographs of CGRP expression. (C) High magnification images show a visual difference in the statistics. The anatomic position of CGRP expression was separately accounted for the dorsal and ventral positions. The CGRP of dorsal horn (arrows) showed the highest expression of whole horizontal view of spinal cord. The values represent means ± standard deviation (SD) for 10 rats for each group. *P < 0.05, compared to control and Cremophor EL groups. Scale bars = 200 μm and 100 μm for (B) and (C), respectively.
