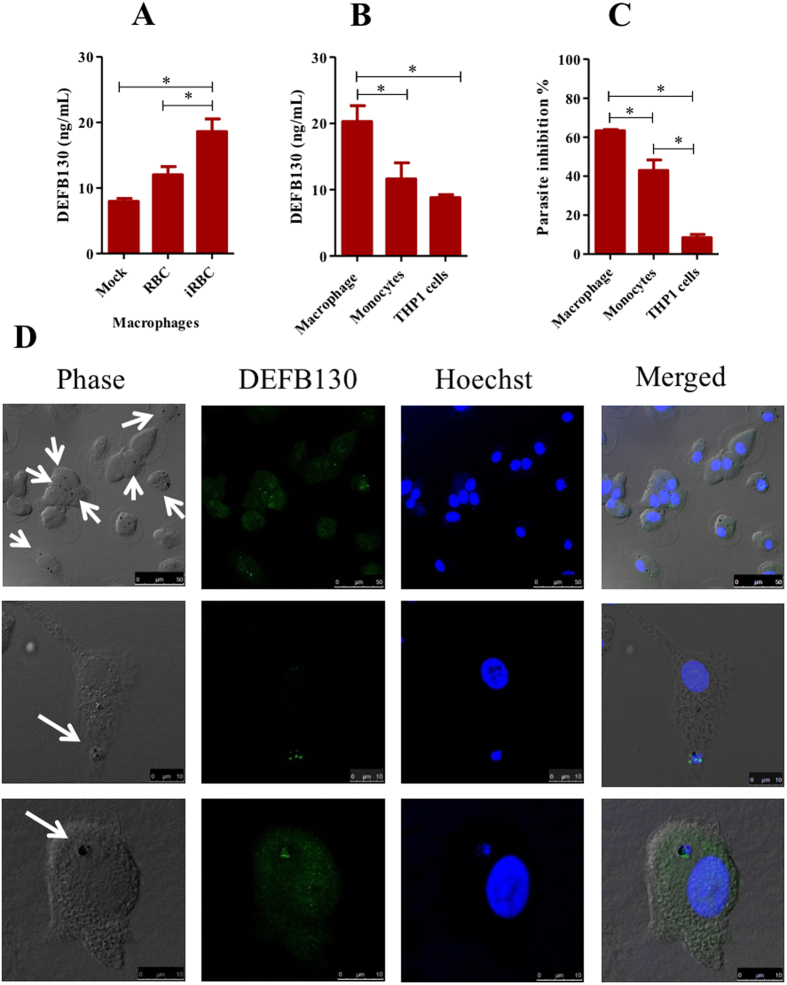
Figure 2. Analysis of the DEFB130 response in macrophage-phagocytizing iRBCs.
(A) Protein level of DEFB130 in macrophages cultured with iRBCs or RBCs as detected by ELISA. Differentiated macrophages were either cultured alone with medium (Mock) or cultured with RBC and iRBCs for 2 h in 96-well plates. Human RBCs or iRBCs were added to macrophage cultures at 1:20 ratio. (B) Comparison of DEFB130 production from different phagocytic cells. The level of protein was quantified by ELISA in differentiated macrophages, primary monocytes, and THP1 cells cultured with iRBCs. (C) Parasite inhibition after culturing phagocytes with enriched-iRBCs. Percentage of inhibition was calculated based on the parasite biomass in the wells containing iRBC with no phagocytic cells. Phagocytic cells were cultured with enriched iRBCs (1:20) for 2 h in 96-well plates. Each bar represents the mean ± SEM for each group (n = 5) and the results are representative of at least two independent experiments. *Indicates a significant difference between the groups as analyzed by one-way ANOVA analysis of variance, followed by Tukey’s multiple-comparison test. (D) Intracellular localization of DEFB130 in macrophages phagocytizing iRBCs examined by confocal microscopy. Differentiated macrophages cultured with iRBCs for 2 h on coverslips and then the coverslips were fixed and stained by specific antibody. Green indicates specific reaction with DEFB130 antibody and blue indicates Hoechst nuclear staining. Arrows indicate the phagocytized iRBCs. Scale bar is indicated on each image.

