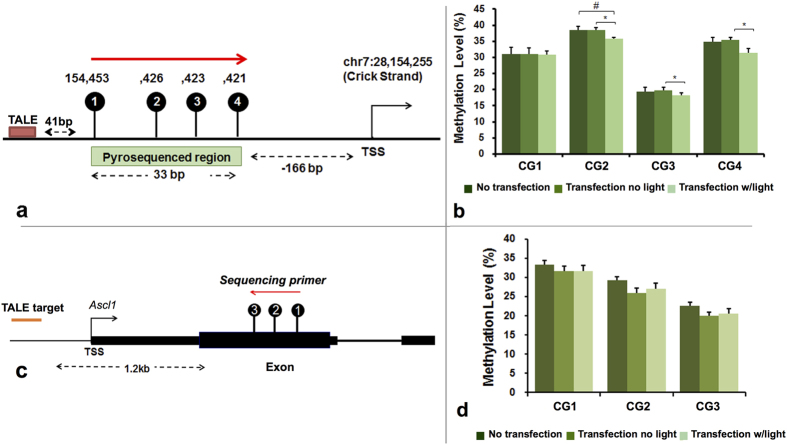
Figure 4. Optogenetic induction of site-specific methylation in STR cells using TET1-CRY2-EGFP.
(a) Pyrosequenced region in the TALE target sites (b) DNA methylation level of TET1-CRY2-EGFP and TALE co-transfected STR cells in the sequenced region illustrated in (a). (c) Pyrosequenced region in non-TALE targeting site. Methylation in non-TALE target region was accessed in (d) TET1-CRY2-EGFP and TALE co-transfected STR cells. The extent of changes in methylation was compared between No-transfection, transfection no light, and transfection with light. Student’s paired t-test with two tails was used for statistical analysis. Data presented as mean ± SEM. N = 5 for each group. #P < 0.1; *P < 0.05; **p < 0.01.

