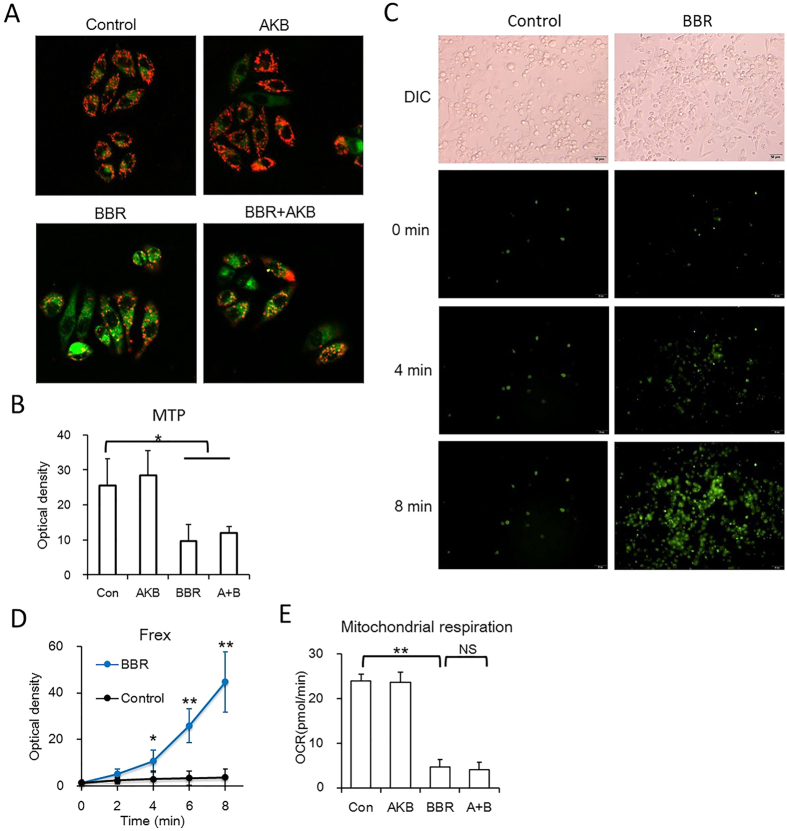
Figure 3. BBR reduces mitochondrial activity and AKB could not rescue that process.
(A,B) BBR reduced mitochondrial membrane potential. HepG2 cells were stained by JC-10. (A) Representative confocal images (20×). (B) Statistical analysis of the optical density of the 590 nm of JC-10 aggregates. BBR 60 μmol/L, AKB 1 mmol/L. Mean ± SEM; *p < 0.05, **p < 0.01, n = 6. (C,D) BBR induced NADH concentration rise, indicated by Frex protein, a fluorescent biosensor of NADH. BBR 60 μmol/L. (C) Representative living cell images (20×). (D) Statistical analysis of the optical density of the NADH activated Frex protein. Mean ± SEM; *p < 0.05, **p < 0.01, n = 6. (E) Basal respiration of the HepG2 cells with the indicated treatment. The assay was conducted on a Seahorse XF Analyzer. BBR 60 μmol/L, AKB 1 mmol/L. Mean ± SEM; **p < 0.01, n = 3.

