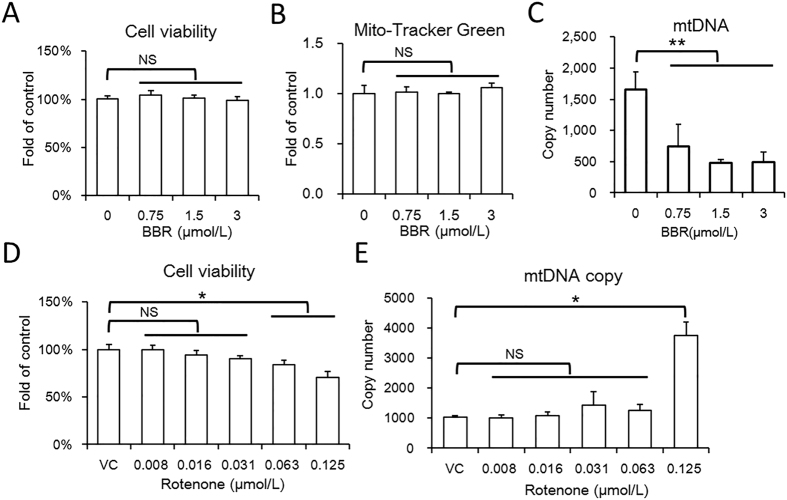
Figure 6. Safety dose of BBR reduce mtDNA copy number.
(A) CCK-8 assay of HepG2 cell treated with BBR. Mean ± SEM; NS no significant difference, n = 6. (B) Mitochondrial biomass of HepG2 cells treated with BBR at the indicated dose. Mitochondrial biomass was determined by MTG assay on a high content system. Mean ± SEM; n = 6. (C) The mtDNA copy number of HepG2 cells with BBR treatment at the indicated doses. Determined by relative quantitative PCR, the genome DNA served as reference. Mean ± SEM; **p < 0.01, n = 3. (D) CCK-8 assay of HepG2 cell treated with BBR. Mean ± SEM; NS no significant difference, *p < 0.05, n = 6. (E) The mtDNA copy number of HepG2 cells with rotenone treatment at the indicated doses. Mean ± SEM; *p < 0.05, n = 3.

