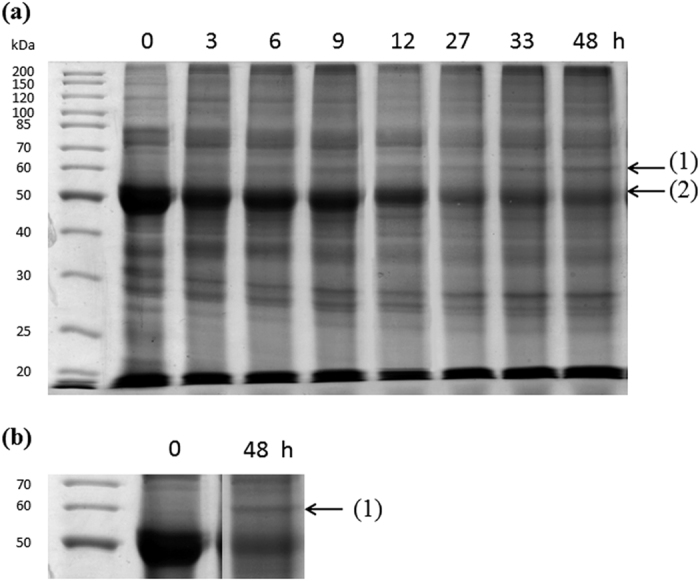
Figure 1. Changes in proteins from cells of T. pseudonana shifted from 20,000 to 50 ppm CO2 over 48 hours.

(a) Proteins extracted at different times after switching the cells from 20,000 to 50 ppm CO2 were run on 12% SDS-PAGE and stained with Coomassie Blue. The first lane corresponds to molecular mass markers (Euromedex), and the other lanes correspond to proteins (20 μg) extracted at the times indicated. The arrows (1) and (2) indicate the position of the LCIP63 and Rubisco large subunit, respectively. (b) Close-up of the gel at the molecular mass of LCIP63 for the control and after 48 h treatment at low CO2.
