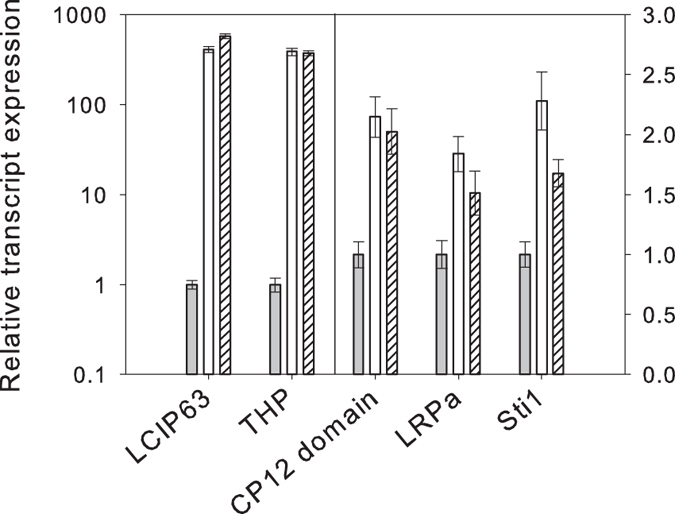
Figure 3. Relative transcript expression for proteins from cells of T. pseudonana at different CO2 concentrations.

RNA was extracted from cells grown at 20,000 ppm (grey bar), switched to CO2 at 50 ppm for 12 h (white bar) and 24 h (hatched bar). Transcript levels are shown for LCIP63, (corresponding to spots 408 and 172, see Table 1), transmembrane hypothetical protein (THP, spot 696 and 422), “CP12 domain” protein (spot 926), light repressed protein a (LRPT, spot 378) and stress-inducible protein sti1 (spot 549). Error bars represent ± 1 SD.
