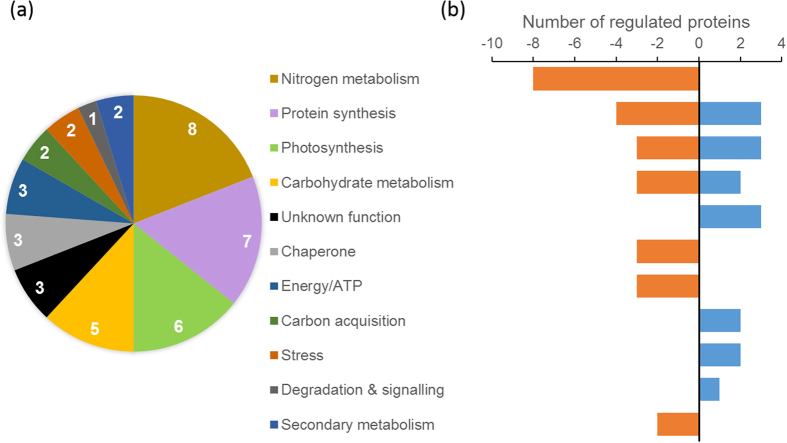
Figure 5. Protein regulation in T. pseudonana for different functional categories on a switch from 20,000 to 50 ppm CO2 for 12 hours.
(a) Number of differentially expressed proteins by functional category, (b) number of proteins classified by functional category that increased (blue) or decreased (orange).

