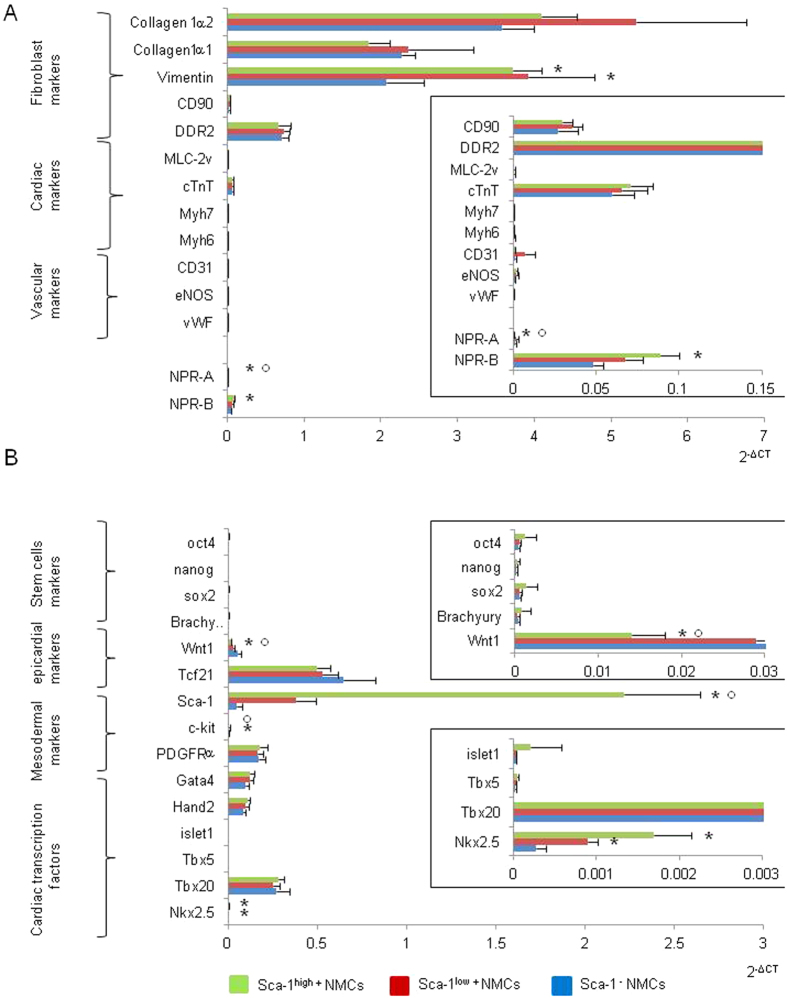
Figure 2. Molecular characterization of sorted Sca-1−, Sca-1low+ and Sca-1high+ cells directly after cell sorting.
Quantitative polymerase chain reactions were performed for genes expressed in differentiated cells (A) or in undifferentiated cells (B). Densities of expression were represented as 2−ΔCT and results are means ± SEM of 6 different cell sortings. Enlargements were represented rights for some genes. *p < 0.05 versus Sca-1− cells and °p < 0.05 versus Sca-1low+.

