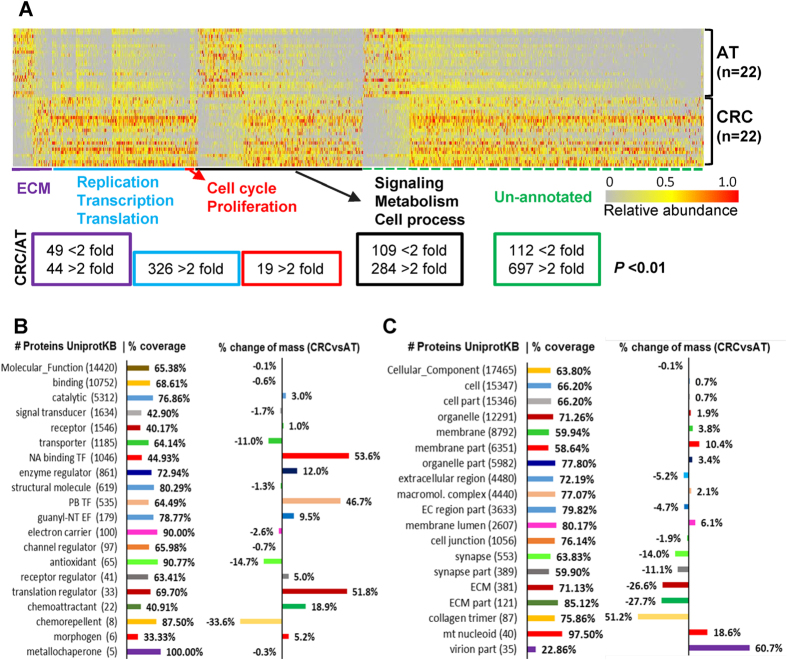
Figure 2. Summary of protein abundance variation in CRC and AT.
(A) Heat map depicting the comparison of the relative abundance of 1,640 ranked individual proteins (fold change >2, p < 0.01, n = 22) between 22 paired CRCs and ATs according to classified annotations. (B and C) Summary of coverage and the grouped protein abundance changes according to the molecular function classification (14,420 protein entries) and cellular component classification (17,465 protein entries). The listed numbers of proteins for each classification were obtained from the UniProtKB website, and the full name for each class is listed in Supplementary Table 2.

