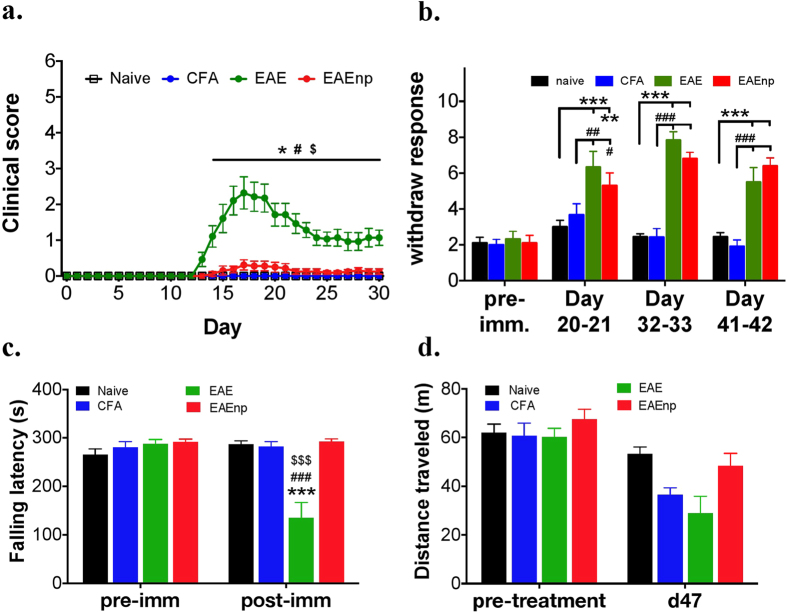
Figure 2. EAEnp mice developed pain without clinical deficits.
(a) Clinical scores of mice in naive (N = 7), CFA (N = 7), EAE (N = 14), EAEnp (N = 16) groups at different days after immunization. Statistics were analyzed by two-way ANOVA (Interaction: F(90,1200) = 10.08; Time: F(30,1200) = 10.64; Treatment: F(3,40) = 20.44). Post-Bonferroni analysis presented in the figure, *p < 0.05 vs. naive group; #p < 0.05 vs. CFA group; $p < 0.01 vs. EAEnp group. (b) von Frey test conducted at selected time points showing hyperalgesia in both EAE and EAEnp mice. Naive: N = 9, CFA: N = 12, EAE: N = 6, EAEnp: N = 10. Statistics were analyzed by two-way ANOVA (Interaction: F(9,99) = 7.769, p < 0.001; Treatment: F(3,33) = 30.03, p < 0.001; Time: F(3,99) = 29.18, p < 0.001). Post-Tukey analysis presented in the figure, **p < 0.01, ***p < 0.001 vs. naive group; ##p < 0.01, ###p < 0.001 vs. CFA group. (c) Rota-rod test shows significantly shorter falling latency in EAE mice than other groups at 47 days post-immunization. Naive: N = 12, CFA: N = 11, EAE: N = 9, EAEnp: N = 11. Statistics were analyzed by two-way ANOVA (Interaction: F(3,39) = 26.3; Time: F(1,39) = 18.1; Treatment: F(3,39) = 11.5). Post-Bonferroni analysis presented in the figure, ***p < 0.001 vs. naive group; ###p < 0.001 vs. CFA group; $$$p < 0.001 vs. EAEnp group. (d) Open field test shows no difference in traveling distance between treatment groups.

