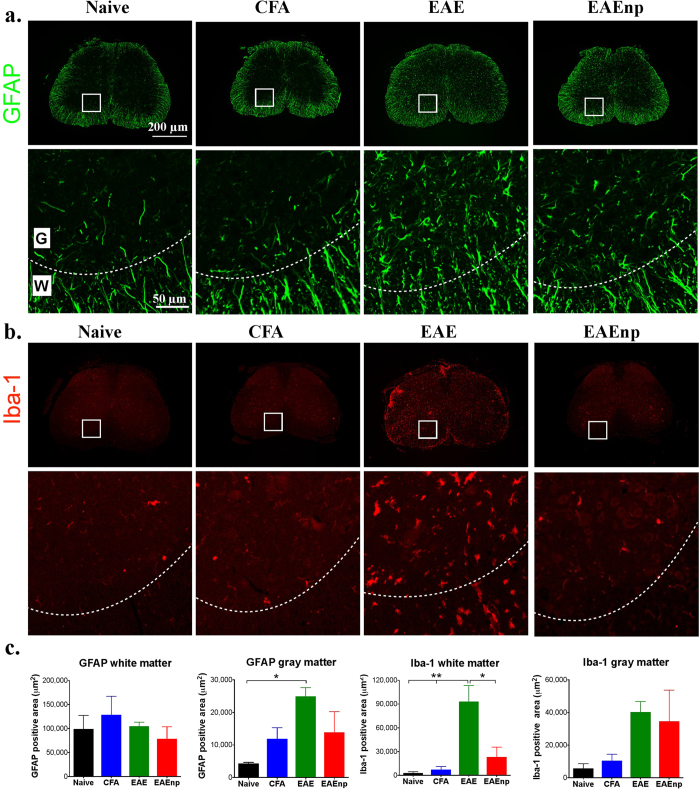
Figure 4. Astrocytes and microglia activation in the spinal cord observed in EAE mice.
Lumbar spinal cord (L4) for each treatment was collected at the peak of disease (d15) and underwent immunofluorescence staining. Magnified images of squared area are shown in the second row of each staining. Dashed curves indicate the border between white matter and gray matter. (a) GFAP staining for astrocytes in each treatment. (b) Iba-1 staining of microglia in each treatment. (c) Quantification of GFAP and Iba-1 staining in white matter and gray matter. Statistics were analyzed by one-way ANOVA (GFAP white matter: F(3,10) = 0.6455, p = 0.6033; GFAP gray matter: F(3,10) = 3.998, p = 0.0414, Naive vs. EAE: p = 0.0427; Iba-1 white matter: F(3,10) = 9.327, p = 0.0030. Naive vs. EAE: p = 0.0055, CFA vs. EAE: p = 0.0075, EAE vs. EAEnp: p = 0.0167; Iba-1 gray matter: F(3,10) = 2.023, p = 0.1747). *p < 0.05, **p < 0.01. Full-sized images and magnified images are in the same scale, respectively. W: white matter; G: gray matter.

