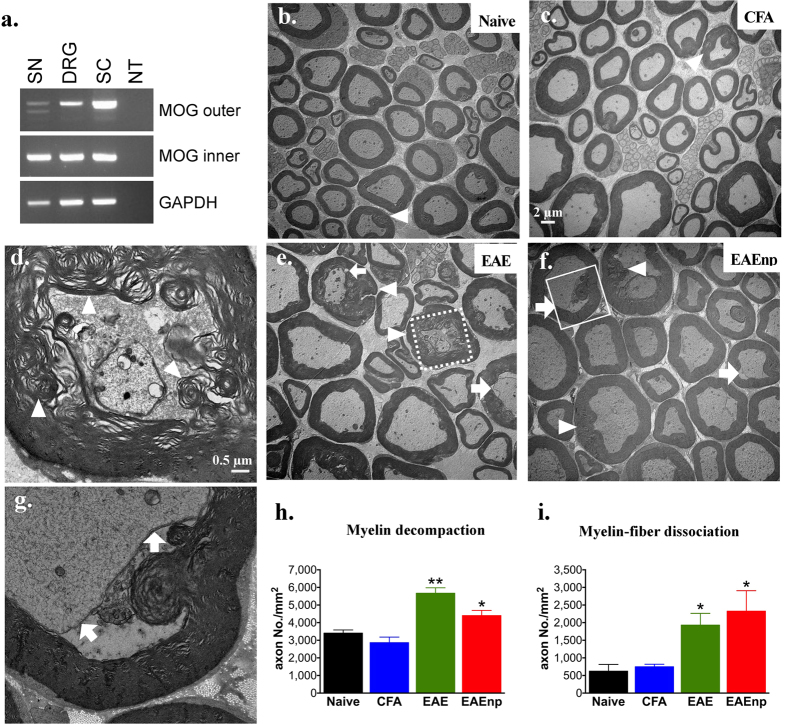
Figure 5. Myelin disruption shown in peripheral nerves in EAE and EAEnp mice.
(a) Myelin oligodendrocyte glycoprotein (MOG) transcripts were detected by nested RT-PCR in sciatic nerve (SN), dorsal root ganglion (DRG), and spinal cord (SC) of naive wild-type mice. NT: negative control. (b,c,e,f) Sciatic nerves of each treatment were dissected at peak of disease (d15) for electron-microscopy image. (d) A representative image of an axon showing decompacted myelin in EAE, square area of dashed line in (e). (g) A representative image of an axon showing myelin-fiber dissociation in EAEnp, square area of solid line in (f). (h) Quantification of decompacted myelin. Statistics were analyzed by unpaired t test (EAE: p = 0.0022, EAEnp: p = 0.0437). (i) Quantification of myelin–fiber dissociation. Statistics were analyzed by unpaired t test (EAE: p = 0.0272, EAEnp: p = 0.0497). ⇧, axons with myelin–fiber dissociation. Δ, axons with decompacted myelin. *p < 0.05 vs. naive group. Naive N = 3, CFA N = 3, EAE N = 4, EAEnp N = 3. Scale in (c,e,f) is the same as (b). (d,g) are in the same magnification.

