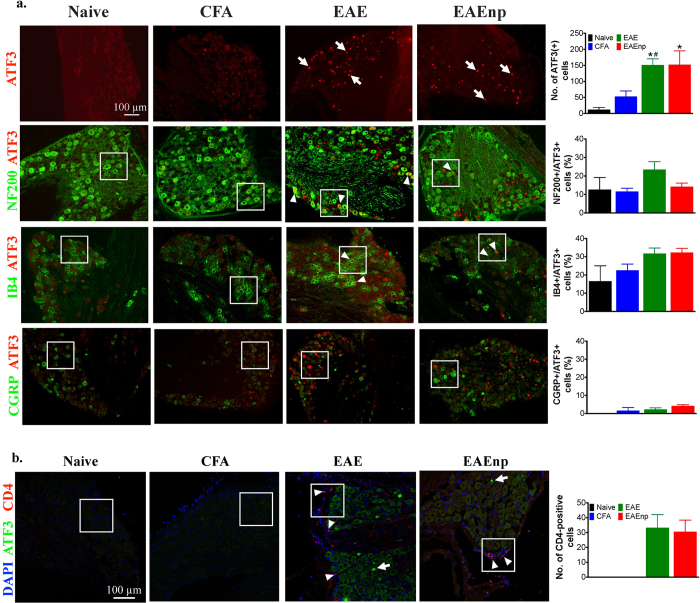
Figure 6. Characterization of ATF3-positive neurons and infiltrating T-helper cells in EAE and EAEnp mice.
DRG at the 4th lumbar segment was isolated from mice of each treatment at disease peak (d15). (a) DRG sections were stained with ATF3 to assess nerve injury. Characterization of injured neurons was assessed by co-staining ATF3 with different neuron markers. NF-200, neurofilament-200 (a marker of myelinated neurons); IB4, isolectin-B4 (a marker of non-peptidergic neurons); CGRP, calcitonin gene-related peptide (a marker of peptidergic neurons). ⇑, ATF3-positive neurons. Δ, co-localization of ATF3 with each neuron marker. Quantitative analysis of ATF-positive neurons and their subtypes in different treatment groups are shown in the right column. Statistics were analyzed by one-way ANOVA, *p < 0.05 vs. naïve group. #p < 0.05 vs. CFA group. All images are in the same scale as indicated in ATF3 staining of Naïve group. b. DRG sections were stained with ATF3 and CD4 to assess the anatomical distribution of injured neurons and infiltrating T-helper cells. ⇑, ATF3-positive neurons. Δ, CD4-positive cells. Quantitative analysis of CD4-positive cells is indicated in the right column. Magnified images of square area are shown in Supplementary Fig. S6.

