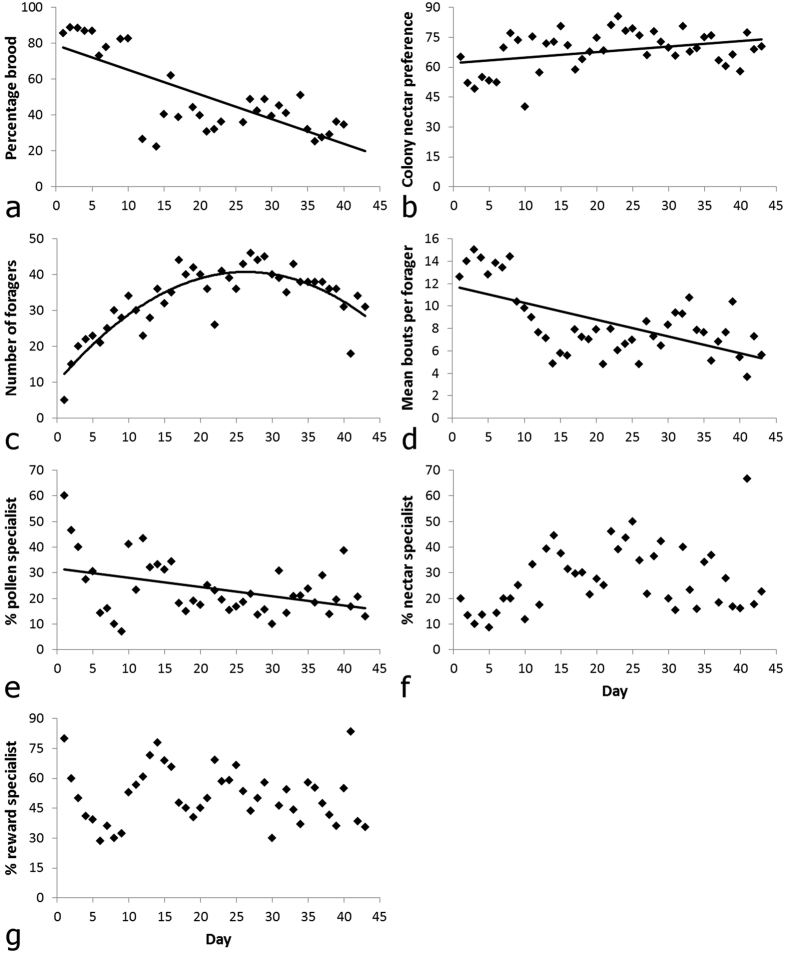
Figure 6. Effects of colony age on its foraging behaviour and on its reproduction.
(a) Percent of the colony surface composed of brood cells, (b) colony nectar collection preference, (c) number of active foragers, (d) mean number of bouts per bee, (e) percentage of bees that specialized on nectar collection, (f) percentage of bees that specialized on pollen collection, and (g) percentage of bees that specialized on either food type, for each day of the experiment. N = 89 bees. N = 33 days for (a–d) and 43 days for (e–g). Plots with trend lines indicate a statistically significant relationship (p < 0.05) according to LMs; although the analysis for (c) was performed via a quadratic model, the quadratic fit for the untransformed data is shown here.

