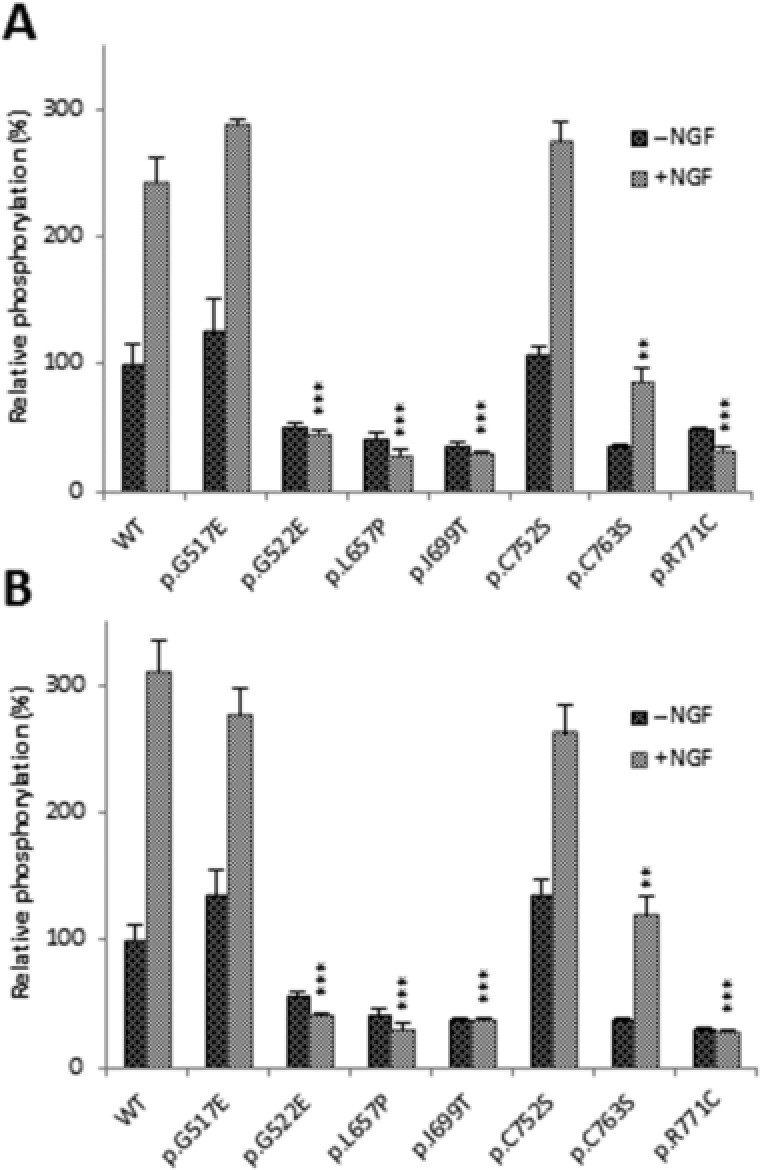
Figure 3.

Relative Y680/681 and Y496 phosphorylation of mutant TRKA. A: Basal level of wild‐type and mutant TRKA‐GFP autophosphorylation in transfected untreated HeLa cells. Response to wild‐type and mutant TRKA‐GFP protein to 15 min stimulation with 100 ng/ml NGF. B: Basal level of Y496 phosphorylation in wild‐type and mutant TRKA proteins in untreated cells and after NGF stimulation. The bar graphs in A and B represents the mean values of n = 3 and error bars represents standard error of the mean. Statistical differences between induced phosphorylation of wild‐type and mutant TRKA are indicated as ** P < 0.01 or *** P < 0.001 (one‐way ANOVA, followed by Student's t‐test using a Bonferroni adjusted P value). WT, wild‐type; EV, empty vector.
