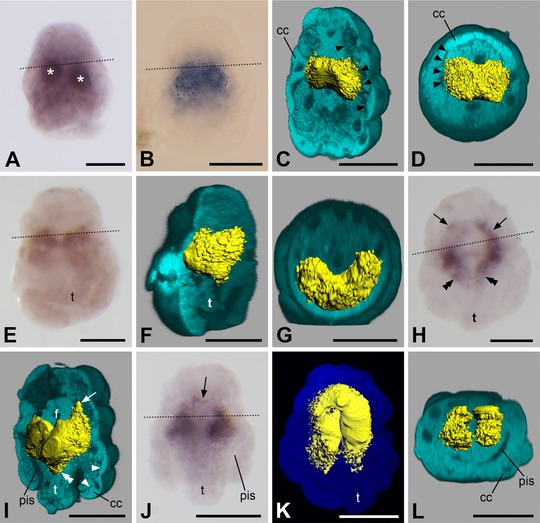
Figure 3.

Expression of twist in larvae of Wirenia argentea. Apical/anterior is up in (A–C), (E), (F), and (H–K); dorsal is up in (D) and (G); ventral is up in (L); scale bar equals 50 μm in all panels; dotted lines indicate the region of the prototroch. (A) 0–1 days posthatching (dph) larva showing a pair of spherical regions with twist expression (asterisks). (B) 0–1 dph larva with peanut‐shaped twist expression domain. (C) 3D reconstruction of a confocal scan with volume rendering (blend mode) of autofluorescence of larva (light blue) and surface rendering of reflection signal of expression domain (yellow); 0–1 dph larva in left ventrolateral view with ventral part of autofluorescence signal omitted. Note that the gene expression signal does not extend to the outermost cell layer of the larva, the borders of which are well visible (arrowheads). (D) Same specimen and reconstruction as in (C) in apical view with apical part of autofluorescence signal omitted. Note that the gene expression signal does not extend to the outermost cell layer of the larva, the borders of which are well visible (arrowheads). (E) 2–3 dph larva. (F) 3D reconstruction of a confocal scan with volume rendering (blend mode) of autofluorescence of larva (light blue) and surface rendering of reflection signal of expression domain (yellow); same specimen as in (E) in left ventrolateral view with left part of autofluorescence signal omitted. Note that the gene expression signal does not extend to the outermost cell layer of the larva. (G) Same specimen and reconstruction as in (F) in apical view with apical part of autofluorescence signal omitted. Note that the gene expression signal does not extend to the outermost cell layer of the larva. (H) 6–7 dph larva showing apical/anterior (arrows) and abapical/posterior (double arrowheads) elongations of the gene expression domain when compared to previous stages. (I) 3D reconstruction of a confocal scan with volume rendering (blend mode) of autofluorescence of larva (light blue) and surface rendering of reflection signal of expression domain (yellow); same specimen as in (H) in left ventrolateral view with ventral part of autofluorescence signal omitted. Note the apical/anterior (arrows) and abapical/posterior (double arrowheads) extension of the gene expression domain when compared to previous stages. The gene expression signal does not extend to the outermost cell layer of the larva, the borders of which are well visible (arrowheads). (J) 6–7 dph larva showing anterior extension of gene expression domain surrounding the developing foregut (arrow). (K) 3D reconstruction of a confocal scan with volume rendering (MIP (max) mode) of autofluorescence of larva (dark blue) and surface rendering of reflection signal of expression domain (yellow); 6–7 dph larva in ventral view. (L) 3D reconstruction of a confocal scan with volume rendering (blend mode) of autofluorescence of larva (light blue) and surface rendering of reflection signal of expression domain (yellow); same specimen as in (K) in posterior view with posterior part of autofluorescence signal omitted. Note that the gene expression signal is only present in the trunk and not in the calymma. pis, peri‐imaginal space; cc, calymma cell; f, developing foregut; t, outgrowing trunk.
