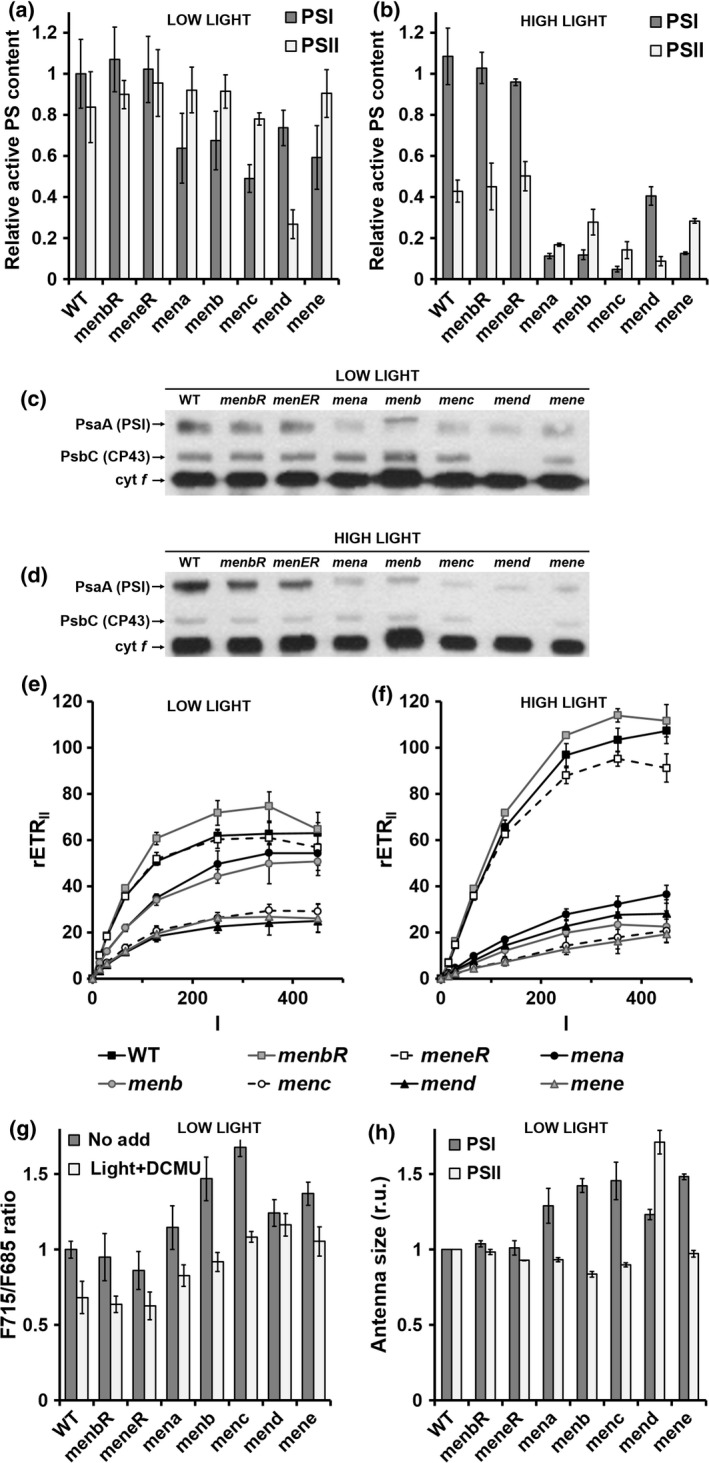
Figure 5.

Photosystem content, antenna size and electron transfer rate in control and mutant strains.
(a), (b) Active photosystem (PS) I and PSII content was estimated from electrochromic shift signals (ECS) at 520–546 nm on cells grown in low light (a) and then transferred for 4 h to a high light intensity (HL; 400 μmol photons m−2 sec−1) (b). The active PSI center content of wild‐type (WT) cells was normalized to 1. Values are the average of three independent experiments. (c), (d) Immunoblots against Chlamydomonas reinhardtii PsaA, Cp43 and cytochrome f proteins of total cell extracts (5 μg protein per lane) prepared from wild‐type, menbR, meneR, mena, menb, menc, mend and mene cells grown in low light (c) and then transferred for 4 h to high light (400 μmol photons m−2 sec−1) (d). The antibodies used are indicated. (e), (f) The PSII relative electron transfer rate (rETRII, μmol electrons sec−1 m−2) as a function of the light intensity (I, μmol photons m−2 sec−1) of cells grown in low light (e) and then transferred for 4 h to high light (400 μmol photons m−2 sec−1) (f). In (e) and (f) values are the average of 10 independent experiments. (g) F715: F685 ratio from fluorescence emission spectra at 77 K. Different pre‐treatments were applied to cell suspensions before freezing: control under white light of 25 μmol photons m−2 sec−1 (‘no add’, dark grey symbols) or illumination by white light of 25 μmol photons m−2 sec−1 in the presence of 20 μm 3‐(3,4‐dichlorophenyl)‐1,1‐dimethylurea (DCMU) (‘light + DCMU’, light grey symbols). (h) PSI antenna size estimated from ECS absorbance transients (520–546 nm) in DCMU (20 μm) + hydroxylamine (1 mm)‐poisoned cells (Figure S5a) and PSII antenna size estimated from chlorophyll fluorescence transients in DCMU (20 μm)‐poisoned cells (Figure S5b). In (g), (h) Wild‐type values were normalized to 1 and all values are the average of three independent experiments.
