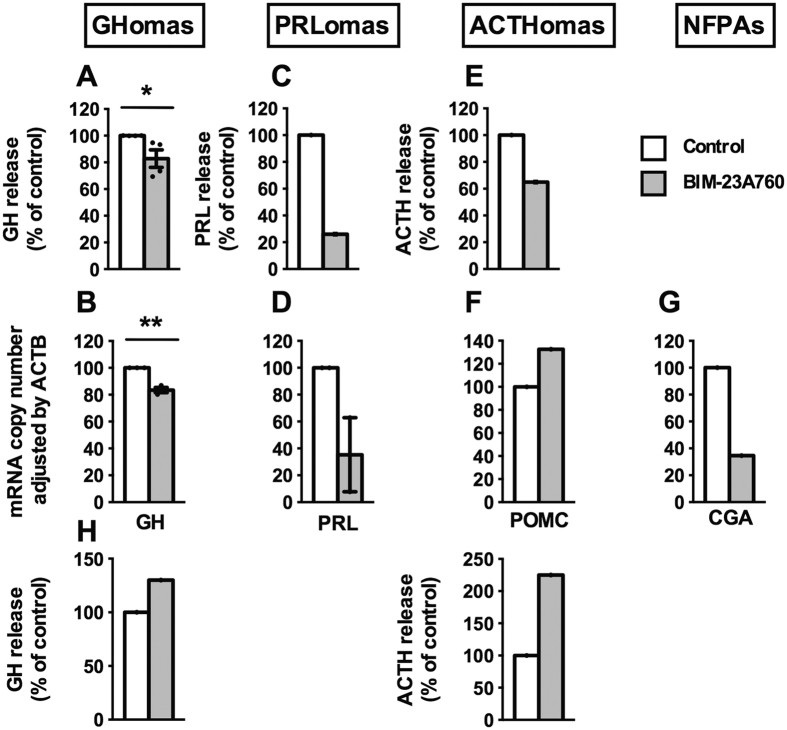
Figure 2.
Effect of BIM-23A760 (100 nM; 24 h) on pituitary hormone release and/or expression in primary human pituitary cell cultures from GHomas (A and B; n = 3–4), PRLomas (C and D; n = 1–2), ACTHomas (E and F; n = 1) and NFPAs (G; alpha-subunit (CGA); n = 1). (H) Stimulatory effect of BIM-23A760 on GH and ACTH release in GHomas and ACTHomas (n = 1). Values are expressed as percent of vehicle-treated controls, set at 100% within experiment. Hormonal release was determined by commercial ELISA kits, and mRNA expression levels were measured by qPCR. mRNA copy numbers were adjusted by ACTB mRNA copy number. Values represent the mean ± SEM. Asterisks show significant differences between BIM-23A760 and vehicle-treated controls (*p < 0.05, **p < 0.01). In cases where only one experiment (n = 1) could be performed, no error bars are presented and no significance tests were performed.

