
Figure 5.
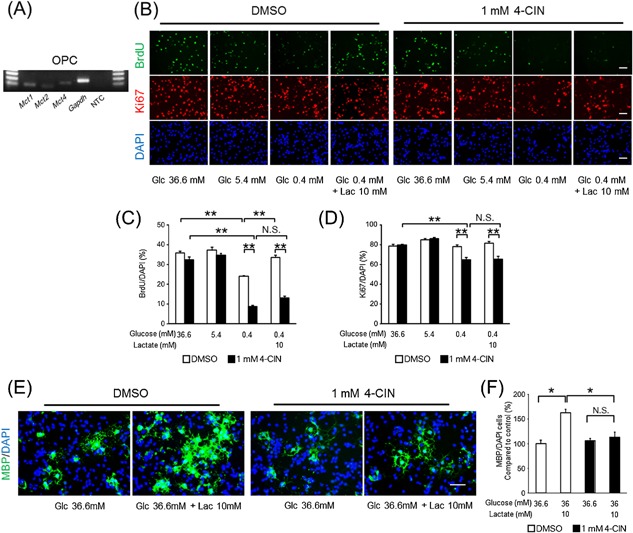
The effects of a monocarboxylate transporter (MCT) inhibitor, 4‐CIN, on OPC‐rich cells in the presence of lactate. (A) Gel imaging of PCR products of Mct1, Mct2, Mct4, Gapdh, and a non‐template control (NTC) of OPC‐rich cultures in growth medium (OPC, 30 cycles). (B) Representative images of BrdU (green), Ki67 (red), and DAPI (blue) staining in each type of growth medium at 1 day. (C) BrdU‐positive and (D) Ki67‐positive cell ratio in each type of growth medium supplemented with 0.1% DMSO (white) or 1 mM 4‐CIN (black) at 1 day (mean ± SEM, n = 3; **P < 0.01). (E) Representative images of MBP (green) and DAPI (blue) staining in each type of differentiation medium at 3 days. (F) MBP‐positive cell ratio in each type of differentiation medium supplemented with 0.1% DMSO (white) or 1 mM 4‐CIN (black) at 3 days (mean ± SEM, n = 4; *P < 0.05). Scale bars: (B and E) 50 μm.