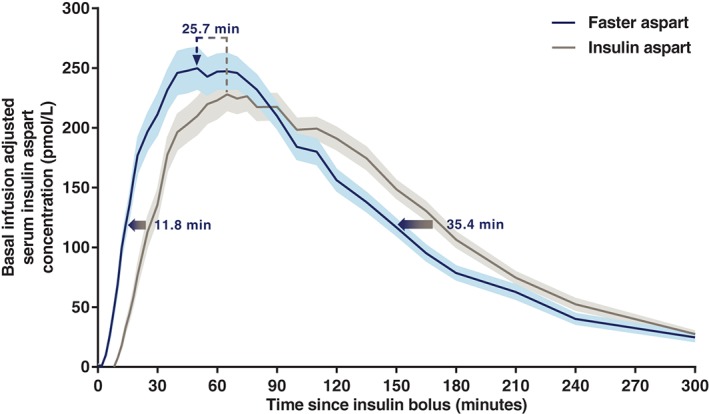
Figure 1.

Mean serum insulin aspart concentration after a bolus dose of 0.15 U/kg faster aspart or insulin aspart administered by CSII. Variability bands show the s.e.m. The full blue/grey arrows indicate that the estimated onset and offset of exposure occurred earlier for faster aspart vs insulin aspart as reflected by the endpoints time to 50% of maximum insulin aspart concentration in the early part of the pharmacokinetic profile (tEarly 50% Cmax; estimated difference [95% CI] faster aspart – insulin aspart −11.8 minutes [−14.4; −9.2]; P < .001) and time to 50% of maximum insulin aspart concentration in the late part of the pharmacokinetic profile (tLate 50% Cmax; −35.4 minutes [−47.0; −23.8]; P < .001). Moreover, as indicated by the dashed arrow, a left shift of the time of maximum insulin aspart concentration was also observed for faster aspart vs insulin aspart (tmax; −25.7 minutes [−34.3; −17.1]; P < .001). For graphical reasons, there are some discrepancies between the length of the arrows and the actual estimated mean treatment differences. This is attributable to the fact that the estimated mean treatment differences are derived from all participants’ individual treatment differences, while the mean serum insulin aspart concentration profiles are derived as the mean of all individual serum insulin aspart concentrations at each time point. Faster aspart, n = 44; insulin aspart, n = 46.
