
Figure 3.
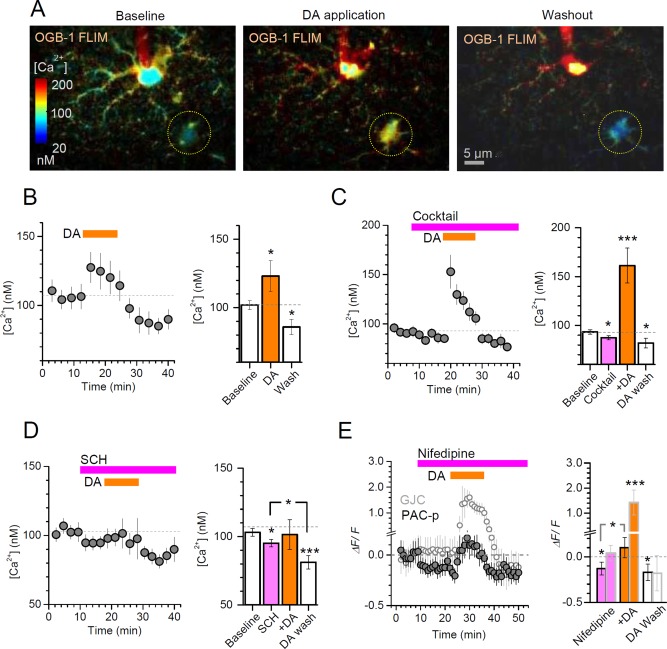
Dopamine evokes a bi‐phasic, bi‐directional Ca2+ response in CA1 astroglia. A: An example showing the monitoring of basal [Ca2+] in CA1 GJC astroglia (dotted circle) with two‐photon excitation FLIM of OGB‐1 (as in (Zheng et al., 2015)) loaded through the patched cell (centre); internal [Ca2+] levels are colour‐coded, as indicated; averaging window is 2 min. B: Plot, average time course of intracellular [Ca2+] (mean ± SEM, n = 8) during application of DA (100 µM, orange bar), as indicated; bar graph, statistical summary (mean ± SEM over the experimental epochs); *P < 0.05, significance level relative to baseline (dashed line). C: Plot, average time course of intracellular [Ca2+] (mean ± SEM, n = 17) during the application of a receptor blocker cocktail (in µM: 1 MPEP, 50 PTX, 1 TTX, 1 CGP52432, 50 A‐AP5, 25 DNQX, 100 LY367385, 0.5 LY341495) followed by DA application (100 µM, orange bar), as indicated; bar graph, statistical summary (mean ± SEM over the experimental epochs); *P < 0.05, **P < 0.01, ***P < 0.005, significance level relative to baseline [Ca2+] (dashed line). D: Plot, average time course of intracellular [Ca2+] (mean ± SEM, n = 11) during the application of the D1/5 receptor blocker SCH23390 (20 μM) followed by DA application (100 µM, orange bar), as indicated; bar graph, statistical summary; notation as in B. E: Plot, average time course of Ca2+‐dependent fluorescence (ΔF/F of Fluo‐4; mean ± SEM, n = 5) in GJC astroglia (hollow circles) and in peripheral processes of PAC (PAC‐p, filled circles) during the application of the L‐type Ca2+ channel blocker nifedipine (20 μM) followed by DA application (100 µM, orange bar), as indicated; bar graph, statistical summary (ΔF/F mean ± SEM over the experimental epochs); PAC‐p data are marked by light grey borders; other notations as in B–D.