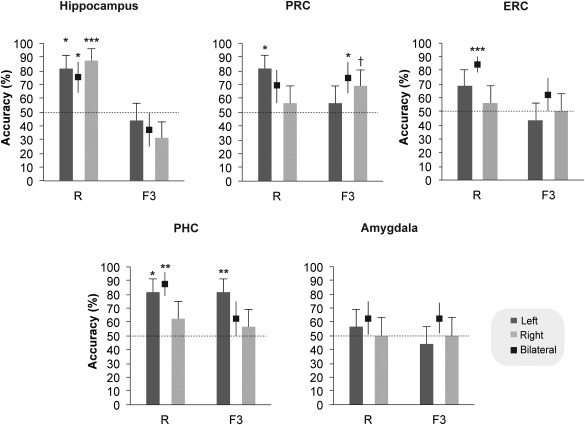
Figure 5.

Multivariate pattern recognition classification accuracy for R and F3 responses in the hippocampus, the perirhinal cortex (PRC), the entorhinal cortex, the parahippocampal cortex (PHC) and the amygdala. Error bars indicate the standard error of the mean across participants. * P < 0.05; ** P < 0.01; *** P < 0.001; † P = 0.08 (trend). P‐values were obtained through permutation testing with 1000 permutations.
