Figure 1.
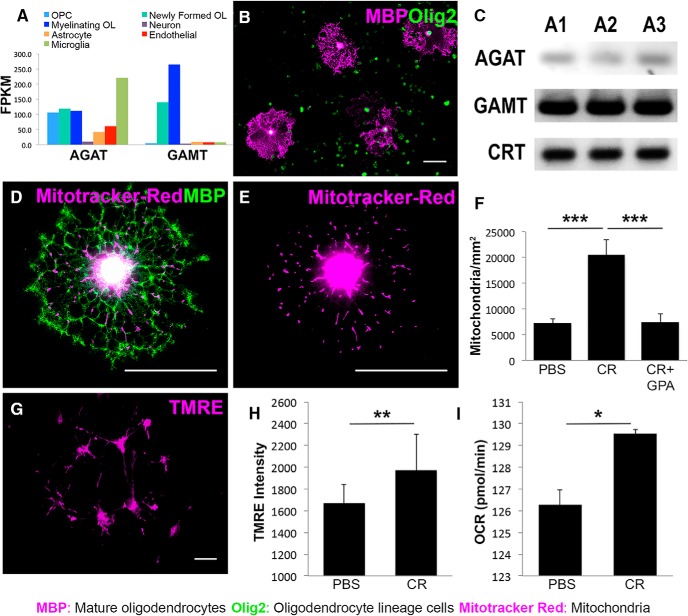
Creatine increases oligodendrocyte mitochondria density, membrane potential, and ATP production. A, Graphical representation of cell-specific Agat and Gamt RNA levels obtained from a publicly available RNA-sequencing transcriptome database (http://web.stanford.edu/group/barres_lab/). FPKM represents fragments per kilobase of transcript sequence per million mapped fragments (Zhang et al., 2014). B, DIV 10 oligodendrocyte lineage cells cultured via MACS. OPCs are Olig2+ (green) and mature oligodendrocytes are double positive for Olig2+ and MBP+ (magenta) (20×) C, MACS-purified oligodendrocytes from n = 3 mice (A1–A3) express transcripts for the creatine biosynthetic enzymes, Agat and Gamt, and the creatine transporter, CrT, via RT-PCR. D, MBP+ (green) oligodendrocyte with mitochondria (magenta) labeled with MitoTracker Red. E, Same image shown in D displaying mitochondria (magenta) only. F, Density of mitochondria per square millimeter counted in the processes of MBP+ oligodendrocytes in MACS-purified oligodendrocyte lineage cell cultures expanded until DIV 7 and differentiated until DIV 9, when they were treated with PBS, 100 μm creatine (CR), or CR + 100 μm GPA for 24 h. n = 12 cells/condition; one-way ANOVA with Bonferroni post hoc test. G, Live-cell TMRE (magenta) image showing labeled mitochondria in living oligodendrocytes. H, Quantification of average fluorescent intensity of TMRE signal from oligodendrocyte lineage cell cultures expanded for 24 h and differentiated until DIV 3, when they were treated with PBS or CR for 24 h. n = 2 wells/condition; Student's t test. I, Results of Seahorse extracellular flux analysis showing average oxygen consumption rate (OCR) in picomoles per minute during ATP production in oligodendrocyte lineage cell cultures expanded for 24 h and differentiated until DIV 3, when they were treated with PBS or CR for 24 h. n = 2 wells/condition; Student's t test. Data are represented as mean ± SEM. Scale bars, 50 μm. Brightness and contrast were adjusted for visualization. *p < 0.05, **p < 0.01, ***p < 0.001, ****p < 0.0001.

