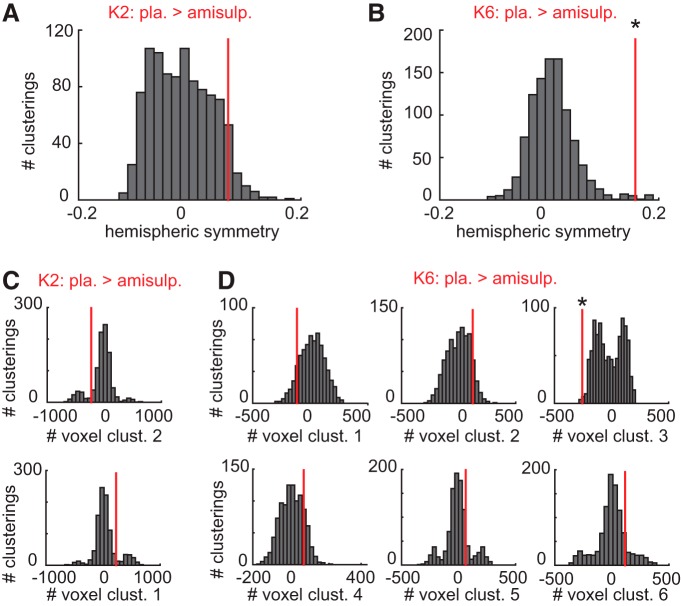
Figure 3.
Comparison of groupwise parcellations. A, Histogram of the difference in hemispheric symmetry between the pairs of K2 parcellations from randomly assigned groups. Red vertical line depicts the empirical difference in hemispheric symmetry between the placebo group and the amisulpride group. B, Same as in A, but for the K6 parcellation. C, Each histogram depicts the difference in the cluster size (number of voxels) between two randomly assigned groups in clusters 1 (top) and 2 (bottom) of the K2 parcellation. Red vertical lines depict the empirical difference in cluster size between the placebo and amisulpride groups. D, Same as in C, but for the K6 parcellation. Asterisks indicate significant differences from zero at p < 0.05.

