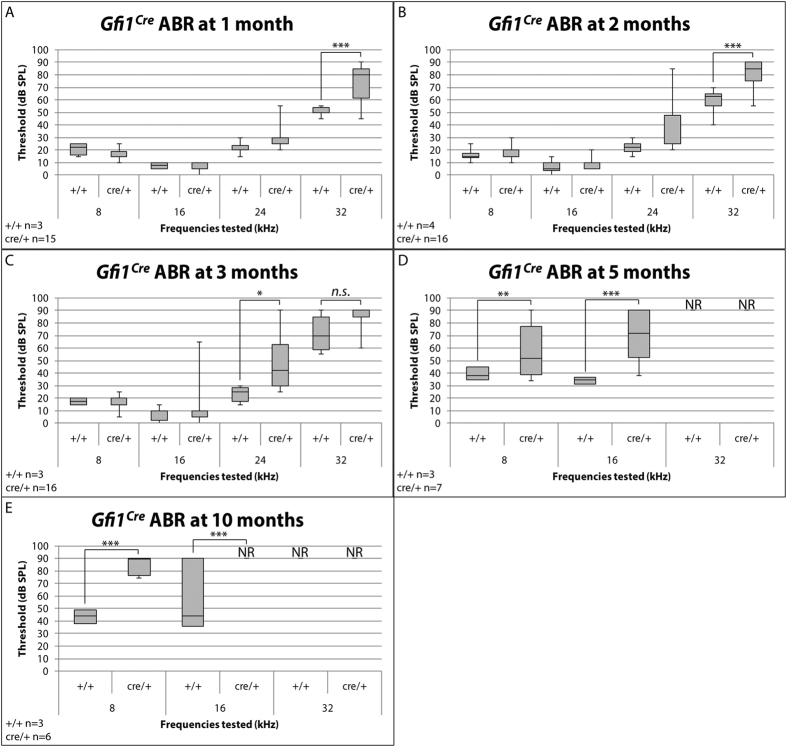
Figure 5. Gfi1Cre heterozygotes exhibit an early onset progressive hearing loss.
Gfi1Cre/Cre mice showed absent ABR thresholds (>90 dB SPL, highest stimulus tested) at all frequencies and time points (up to 3 months). (A) Elevated hearing thresholds can be seen in one month old Gfi1Cre/+ mice (cre/+) as compared to Gfi1+/+ (+/+) littermates at 32 kHz (p-value = 6.40E-05). (B) High frequency hearing loss worsens as heterozygous mice age, as Gfi1Cre/+ mice have more pronounced elevated hearing thresholds compared to Gfi1+/+ at 32 kHz at 2 months (p-value = 2.72E-06). (C) At 3 months of age, Gfi1Cre/+ mice now show significantly elevated hearing thresholds at 24 kHz as compared to Gfi1+/+ littermates (p-value = 0.029), however both Gfi1Cre/+ and Gfi1+/+ mice show elevated hearing thresholds at 32 kHz (p-value = 0.076). (D) At 5 months old, Gfi1Cre/+ mice show significantly elevated hearing thresholds at both 8 kHz and16 kHz as compared to Gfi1+/+ littermates (p-value = 6.64E-03 and 7.11E-05, respectively), and (C) at 10 months old, Gfi1Cre/+ mice still show significantly elevated hearing thresholds at 8 kHz and 16 kHz as compared to Gfi1+/+ littermates (p-value = 3.37E-13 and 3.86E-04, respectively). *Note: at 10 months, one Gfi1+/+ mouse exhibited no response to sound stimuli at 16 kHz, while others showed average thresholds of 40.1 dB SPL. We believe that this mouse is an outlier, based on known hearing phenotypes of aged wild-type mice, but was still included in this analysis. Animal numbers: 1 month Gfi1+/+ n = 3, Gfi1Cre/+ n = 15; 2 months Gfi1+/+ n = 4, Gfi1Cre/+ n = 16; 3 months Gfi1+/+ n = 3, Gfi1Cre/+ n = 16; 5 months Gfi1+/+ n = 3, Gfi1Cre/+ n = 7; 10 months Gfi1+/+ n = 3, Gfi1Cre/+ n = 6. NR = no response (>90 dB SPL), n.s. =not significant, * = p-value < 0.05, **=p-value < 0.01, ***=p-value < 0.001. Significance was assessed by two-way ANOVA, followed by Tukey’s test to account for multiple comparisons, and data displayed as box plots to show variability in hearing phenotypes in Gfi1Cre/+ mice.

