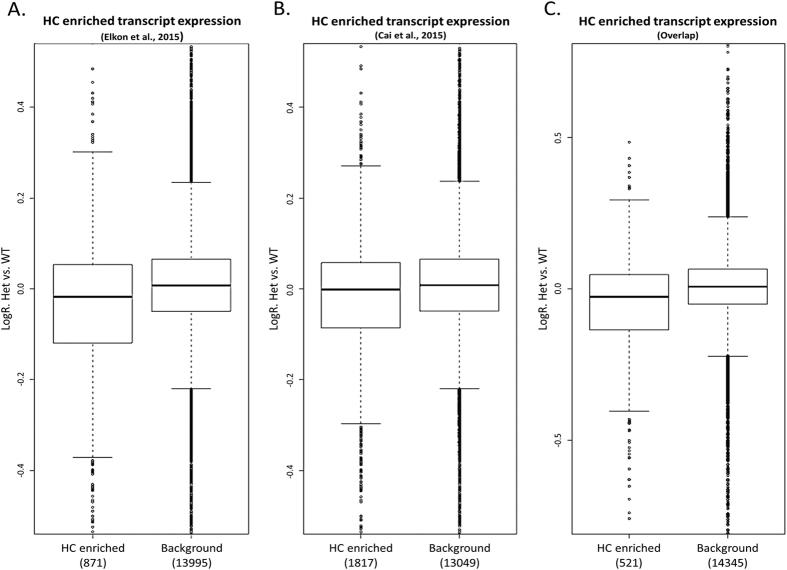
Figure 6. Gfi1Cre/+ cochleae display slight downregulation of HC-enriched transcripts.
The distribution of relative gene expression levels (fold change values in log2 scale) between Gfi1Cre/+ (Het) and Gfi1+/+ (WT) samples was calculated for sets of HC-enriched transcripts and compared with the fold change of remaining genes in the dataset (background). HC-enriched sets of genes (consisting of genes that showed at least 3-fold elevated expression in HCs compared to non-HCs from either the (A) Elkon et al. dataset (871 genes), (B) Cai et al. dataset (1,817 genes) or (C) defined by the overlap between these two datasets (521 genes)), exhibited statistically significant decreased expression in Gfi1Cre/+ P8 cochlea compared to their wild-type control (p-values = (A) 1.67E-15, (B) 6.03E-11, (C) 1.17E-14, calculated using Wilcoxon’s test).

