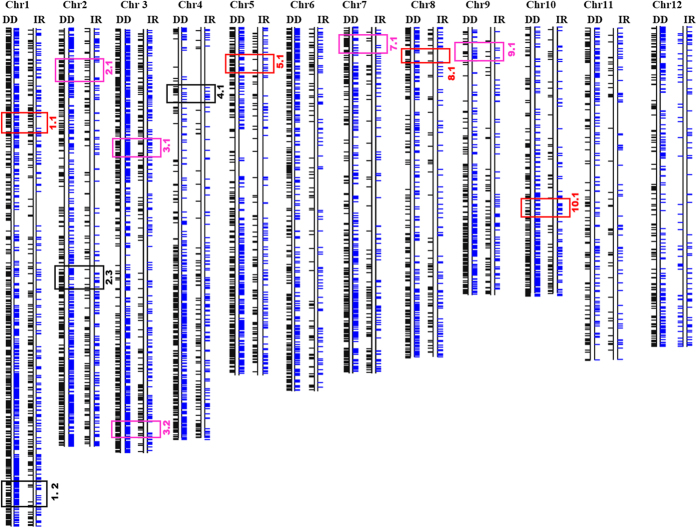
Figure 10. Distribution of DEGs from Dhagaddeshi and IR 20 after 3 h of drought stress on rice chromosomes.
Horizontal dash indicates a gene positioned to its known physical position on chromosome. Black and Blue horizontal dashes represent up-regulated and down-regulated genes (after 3 h of drought stress) on chromosomes, respectively. The identified genomic blocks with a difference in expression pattern between the two cultivars are highlighted in red (significantly up and down-regulated), black (significantly up-regulated only) and pink (significantly down-regulated only) for p-value < 0.05.

