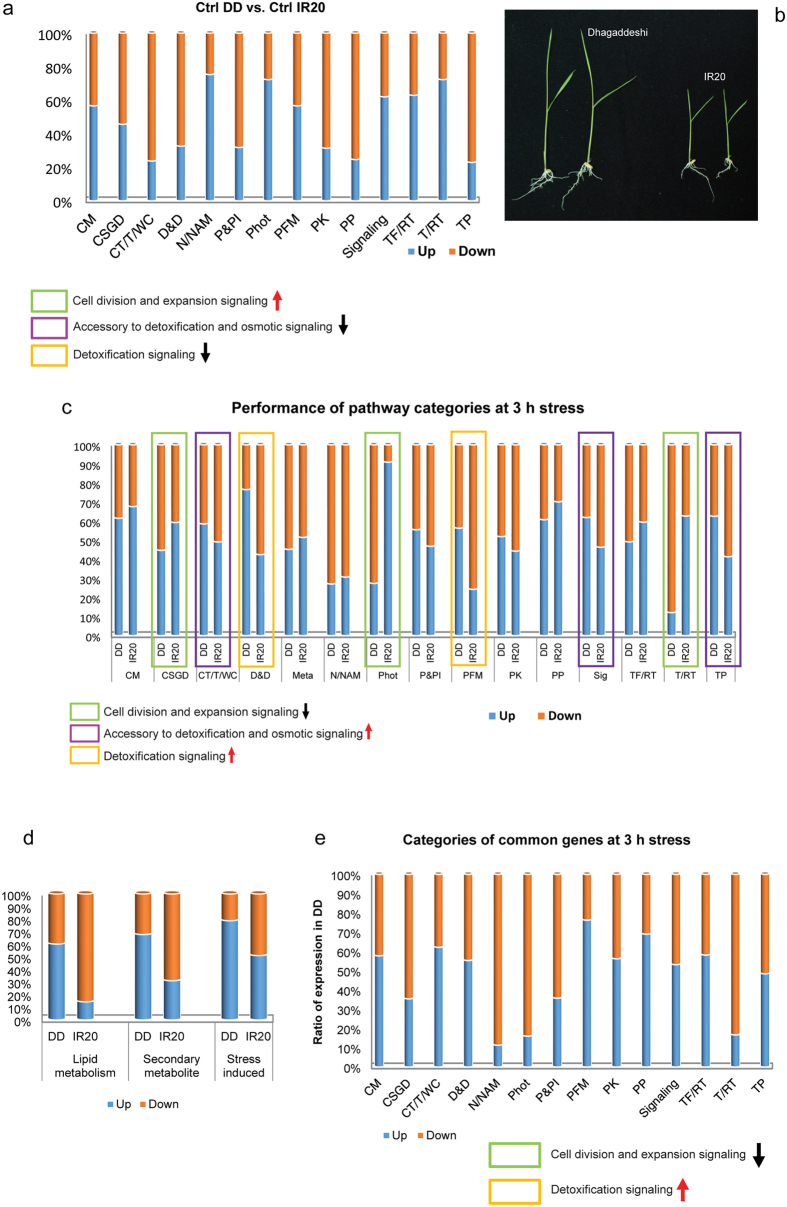
Figure 3. Performance of pathway categories in control conditions and 3 h stress.
(a) Proportion of the pathway categories at unstressed conditions in DD as compared to IR20. (b) Photograph displaying the phenotype of the hydroponically grown 7-day-old seedlings of DD and IR20. The seedlings of DD are considerably taller than IR20. (c) Stacked graph of categories in DD and IR20. (d) Contributions of accessory categories involved in cell integrity and stress perception. (e) Relative expression of common genes in DD and IR20 divided into separate categories. Values indicate the nature of expression in DD as compared to IR20. CM – carbohydrate metabolism, CSGD – cell structure, growth and dynamics, CT/T/W – cellular transport, transporters and water channels, D&D – degradation and detoxification, N/NAM – nucleoproteins/nucleic acid modifiers, Phot – photosynthesis, P&PI – proteases and protease inhibitors, PFM – protection factors of macromolecules, PK – protein kinases, PP – protein phosphatases, Sig – signaling, TF/RT – transcription factors/regulation of transcription. T/RT – translation/regulation of translation, TP – transmembrane proteins.

