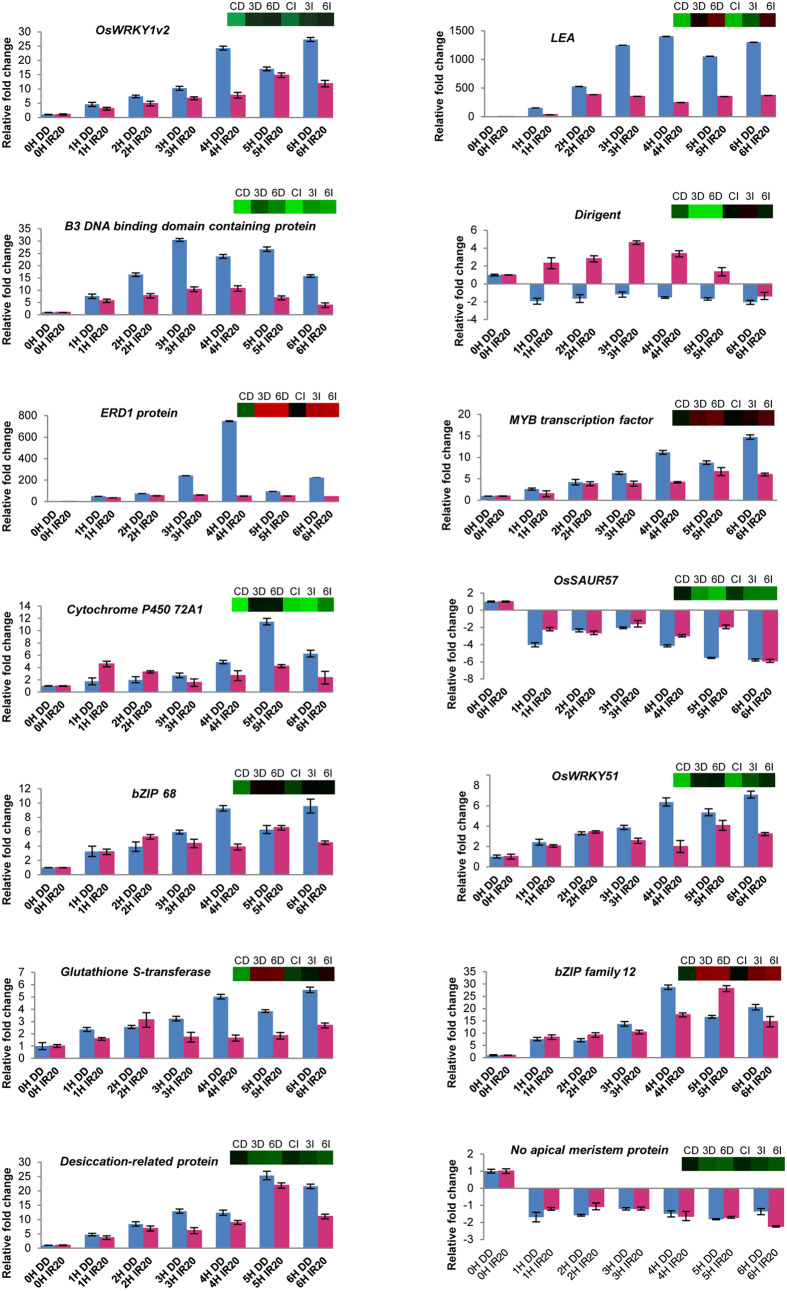
Figure 4. Real time analysis of selected genes in Dhagaddeshi and IR20 over different time points.
Hourly intervals of time points were chosen to see the time kinetics of selected genes in respective cultivars. The microarray derived heat-maps of the genes have also been included with each graph (CD: Control DD, 3D: 3 h DD, 6D: 6 h DD, CI: Control IR20, 3I: 3 h IR20, 6I: 6 h IR20).

