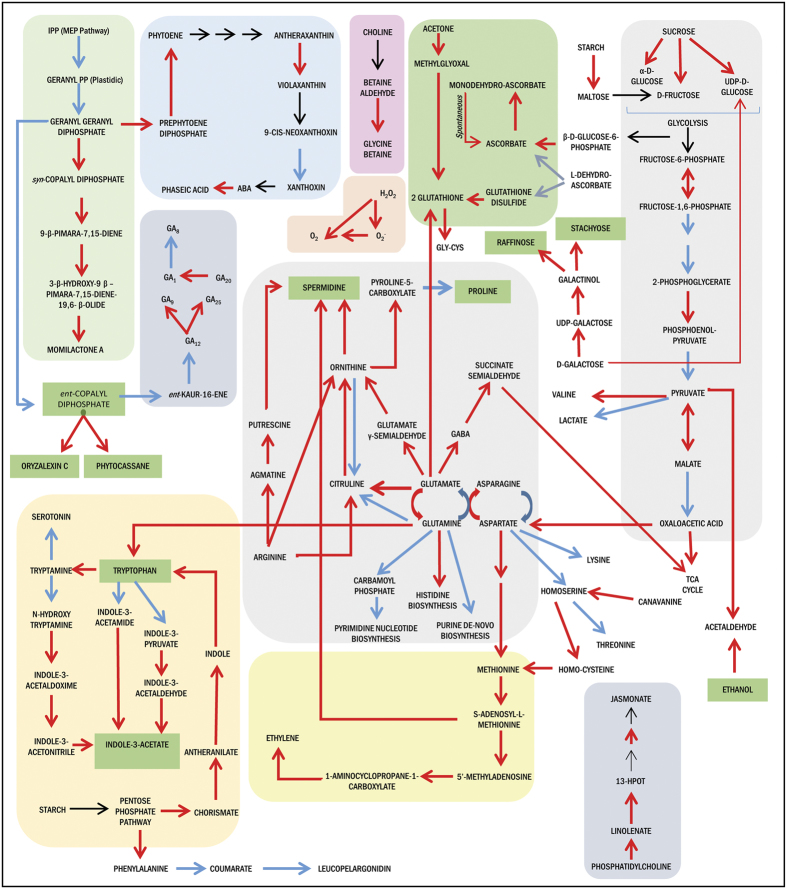
Figure 8. Schematic representation of major metabolic pathways regulated under drought stress.
The metabolic pathways enriched in differentially expressed genes of Dhagaddeshi under 3 h drought stress were reconstructed using Gramene RiceCyc database. Arrows highlighted in Red, Blue or Black represents the expression level of gene loci, i.e. Up-regulated, Down-regulated or unchanged/not represented respectively.

