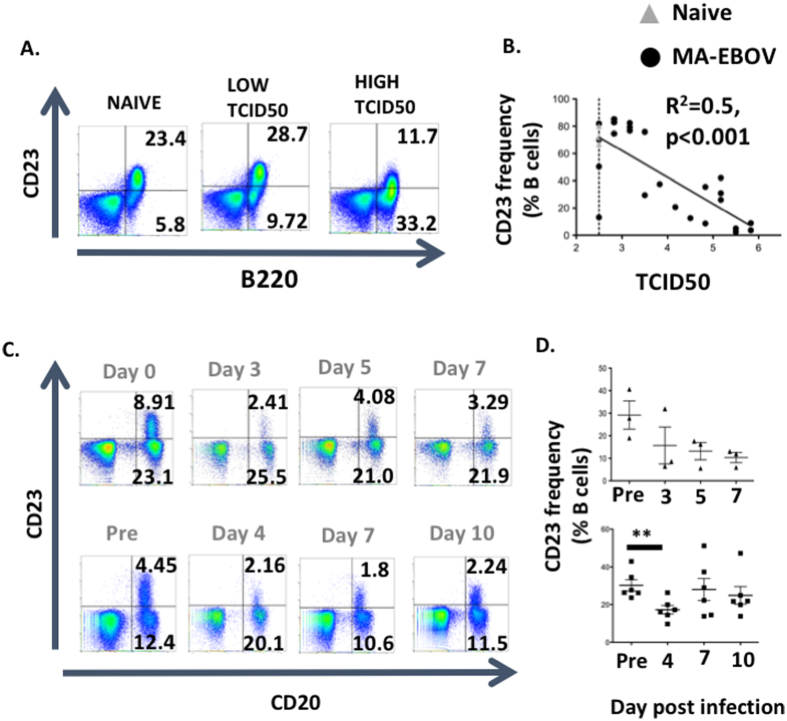
Figure 3. EBOV infection induces polyclonal B cell stimulation.
CD23 surface expression on B cells of infected mice (A,B) and NHP (C,D) was analyzed by FACS. (A,B) CD23 expression was monitored on splenic B cells from surviving mice (n = 28), 7 days after MA-EBOV infection (1 LD50). Naïve uninfected mice (n = 4) were used as control. Representative plots (A) and correlations between CD23 and TCID50 are illustrated (B). Naïve mice are depicted by open triangle while MA-EBOV infected mice are represented by filled circles. Dotted lines indicated the limit of detection for TCID50 using the Spearman Kärber formula. Cumulative data from 4 separate experiments are illustrated (C,D) NHP were infected IM with ~1000LD50 EBOV. Monkey were bleed periodically and CD23 surface expression was measured at the indicated time-points. Representative plots (C) as well as summary data for CD23 surface expression (D) from untreated (top) and Zmapp treated (bottom) NHP are illustrated.

