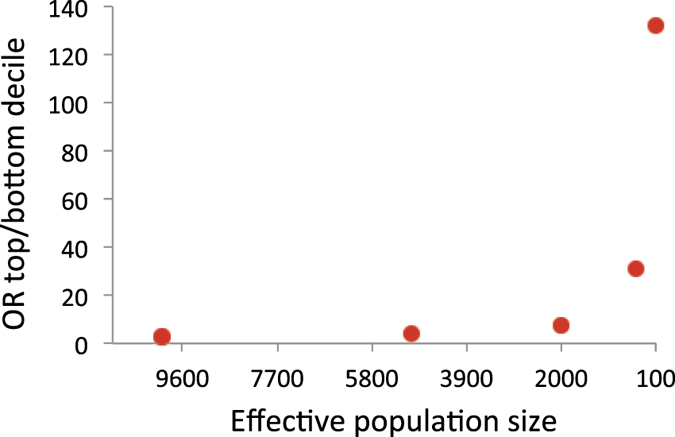
Figure 3. Expected odds ratios of case-control status contrasting the top and bottom 20% of the genetic profile scores in a target sample when varying Ne = 10000, 5000, 2000, 1000 and 100.

The number of records (N) is 3000, the true heritability is 0.5, the number of chromosome is 30 each with a genomic length of 1 Morgan, the population prevalence is K = 0.1 and the proportion of cases in the sample is P = 0.5.
