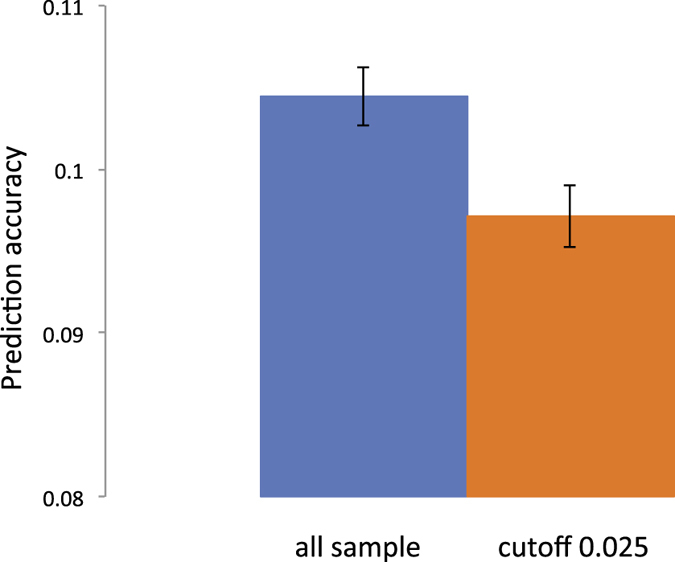
Figure 7. The prediction accuracy is significantly decreased when excluding higher relationships from the sample that results in increasing Me (from 58000 to 67000).

GERA data with hypertension phenotypes are used. The same number of discovery and target sample is used for both tests. The error bar is 95% confidence interval of the observed prediction accuracy over 100 replicates.
