Fig. 1.

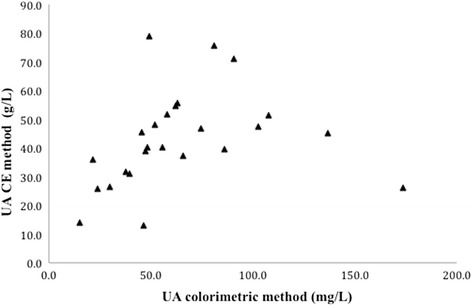
Comparison of the two methodologies (colorimetric and CE) for analyzing urinary uric acid. There was a significant, but weak, correlation when the Kendall Tau test was utilized (R 2 = 0.52, p = 0.0084)

Comparison of the two methodologies (colorimetric and CE) for analyzing urinary uric acid. There was a significant, but weak, correlation when the Kendall Tau test was utilized (R 2 = 0.52, p = 0.0084)