
Fig. 3.
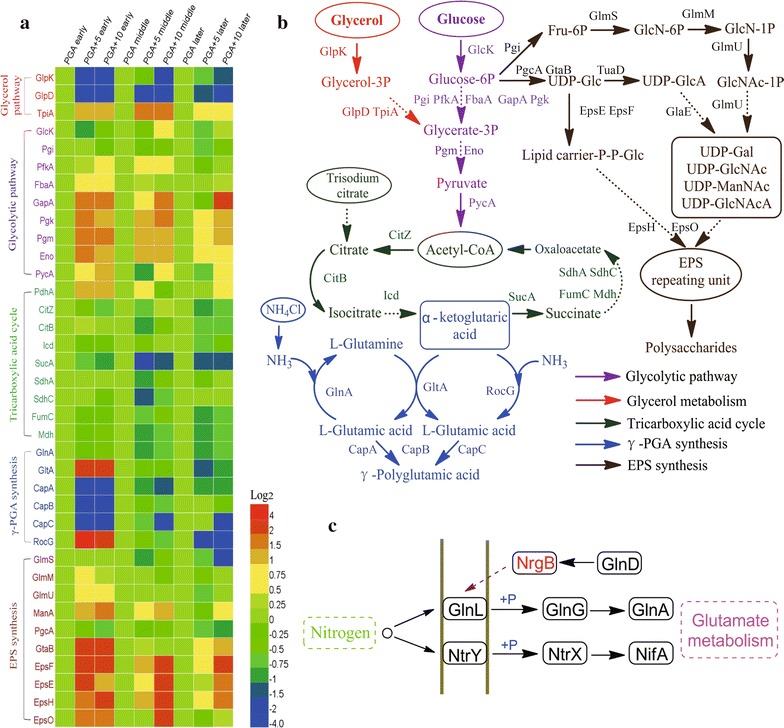
Differential proteome analyses using the SWATH acquisition LC–MS/MS method. a Relative protein abundances are shown here, with red representing highly abundant and purple representing the least abundant in the heat map. b The γ-PGA and polysaccharide de novo synthesis pathways in B. licheniformis. c The regulatory mechanism of protein NrgB