
Fig. 1.
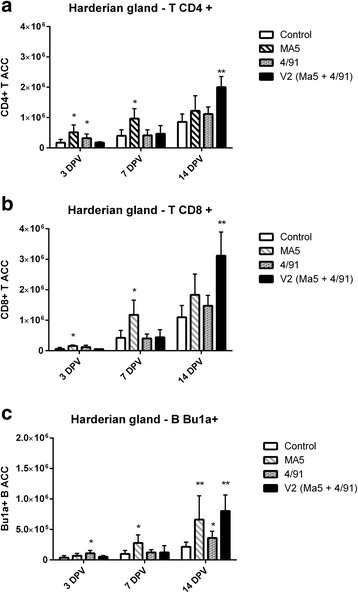
Mean CD4+ (a) and CD8+ (b) T and Bu1a+ B (c) ACC +/− SD in HG samples in different groups and day post vaccination. * Significant differences at different DPV (T-test, * as p < 0,05) in comparison to the control group. ** Significant differences at different DPV (T-test, ** as p < 0,01) in comparison to the control group