
Fig. 1.
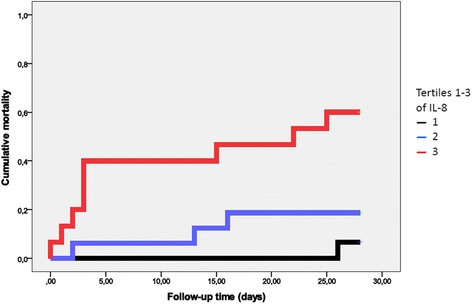
Kaplan-Meier plot showing cumulative mortality during 28 days of follow-up. Tertile 1 denotes the lowest values of IL-8; and Tertile 3 the highest values
Official websites use .gov
A
.gov website belongs to an official
government organization in the United States.
Secure .gov websites use HTTPS
A lock (
) or https:// means you've safely
connected to the .gov website. Share sensitive
information only on official, secure websites.
Kaplan-Meier plot showing cumulative mortality during 28 days of follow-up. Tertile 1 denotes the lowest values of IL-8; and Tertile 3 the highest values