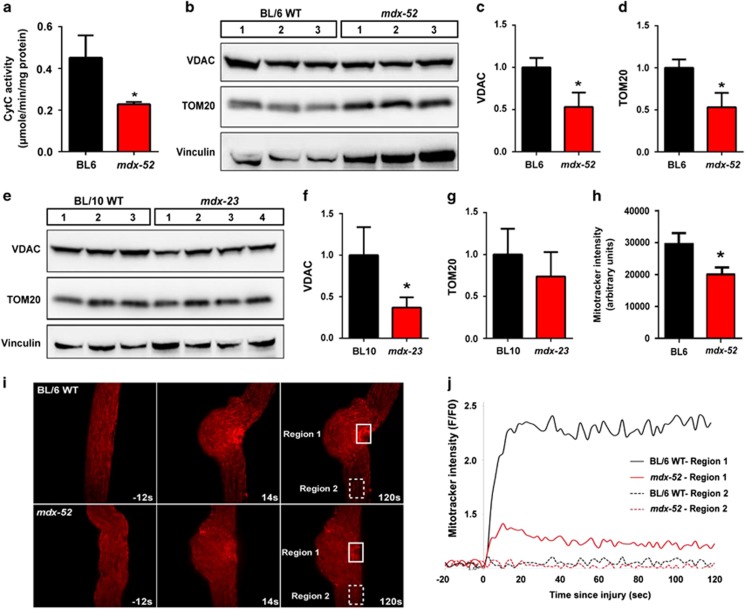
Figure 2.
Mitochondria level and response to sarcolemmal injury are impaired in mdx muscle. (a) Mitochondria were isolated from 28-day-old mdx-52 gastrocnemius muscle and Cytochrome oxidase kinetics was determined spectrophotometrically. Cytochrome C activity was significantly decreased in mdx-52 muscle. (b) WB analysis of mitochondrial structural proteins VDAC and TOM20 in mdx-52 muscle from 28-day-old mice. Quantification of (c) VDAC and (d) TOM20 normalized to loading control (vinculin) shows increased expression of both these proteins over the normalized average WT level. (e) WB analysis of VDAC and TOM20 in the muscle from 28-day-old mdx-23. Quantification of (f) VDAC and (g) TOM20 protein levels normalized to loading control (vinculin) and presented as the fold increase over the normalized average WT level shows increased expression level. (h) Live imaging of mitochondrial activity in muscle fibers from 28-day-old mdx-52 mice labeled with mitochondrial activity sensor dye, MitoTracker CM-H2TMRos. (i) Time-lapse images of mitochondrial dynamics during focal laser injury of sarcolemma within the region marked by the box with solid line (Region 1). Region 2 (box with dotted line) marks a region away from the injury site. Note that accumulation peaked within 20 s of injury. (j) Quantification of mitochondrial accumulation indicated by increase in MitoTracker intensity. Note that mitochondrial accumulation occurred only at the site of injury (Region 1) and peaked within 20 s of injury and was significantly reduced in mdx-52 myofibers. *P≤0.05 by t-test

