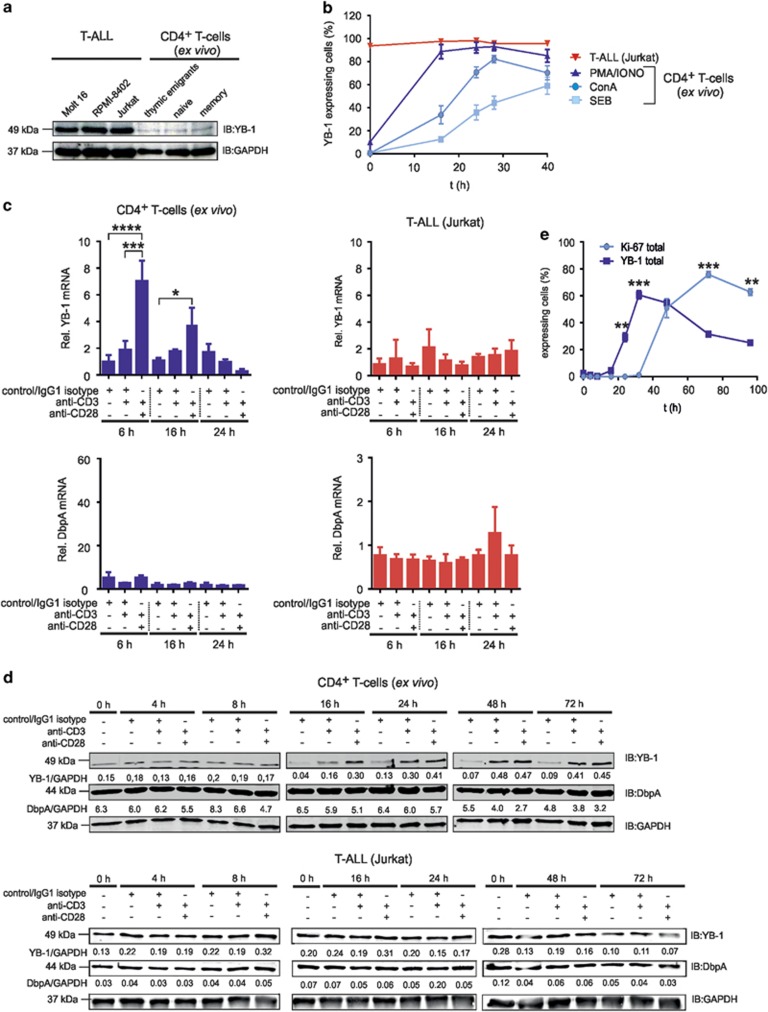
Figure 1.
YB-1 protein expression in primary and malignant human CD4+ T cells. Primary CD4+ T-cell subsets express YB-1 constitutively at low levels, but it is strongly expressed in malignant T-ALL cell lines. (a) T-ALL cell lines were used as indicated. Effector/memory (CD45−RO+CD4+), naive (CD45-RA+CD4+) and recent thymic emigrant (CD45−RA+CD31+CD4+) T cells were isolated from PBMCs of four different donors. In all, 1 × 10⁷ T-ALL cells and each subset of CD4+ T cells (pooled from four different donors) were subsequently lysed, and 30 μg of protein was subjected to 12% SDS-PAGE, and western blotting analysis was performed using the indicated antibodies. Experiments were performed in triplicates and one representative example is shown. (b) PBMCs of four different donors were stimulated either with 1 μg/ml ConA or 1 μg/ml SEB or 10 ng/ml PMA plus 1 μg/ml Ionomycin for specified time points. For flow cytometry, 1 × 10⁶ PBMCs were fixed and permeabilized and subsequently incubated with primary anti-YB-1 c-terminal antibody and fluorescence-labeled secondary antibody together with direct-labeled anti-CD45 Ab, anti-CD3 Ab and anti-CD4 Ab for identification of CD4+ T cells. Frequencies of YB-1-expressing CD4+ T cells of four different donors are shown in the graph, and the mean value and S.E.M. are indicated. (c) YB-1 mRNA expression is significantly enhanced by CD28 co-stimulation. CD4+ T cells and Jurkat cells were stimulated either with IgG1 isotype or anti-CD3/IgG1 isotype or anti-CD3/anti-CD28-coupled beads for the indicated time. The mRNA expression of YB-1 and DbpA in CD4+ T cells and Jurkat cells were performed by qRT-PCR analysis. Graphs show relative transcript levels of YB-1 mRNA and DbpA mRNA normalized to GAPDH (glyceraldehyde 3-phosphate dehydrogenase) mRNA. Data are summarized from three different experiments. The mean value and S.E.M. are indicated. P-values are shown (analysis of variance) *P<0.05, **P<0.01, ***P<0.001, ****P<0.0001. (d) Kinetic of YB-1 expression in stimulated T cells. Activation of CD4+ T cells and Jurkat cells was performed using antibody-coated beads as indicated. As negative controls, either T cells before stimulation were used (0 h) and, in addition, resting T cells incubated with isotype-matched antibodies for each time point (control/IgG1 isotype). YB-1 and DbpA protein expression were analyzed as in panel (a). Samples of two time points were always run on one gel as indicated. GAPDH was used for internal normalization and the numbers indicate relative intensity. Experiments were performed four times, and one representative example is shown. (e) 1 × 10⁶ CD4+ T cells isolated from four different donors were stimulated for 96 h using anti-CD3/anti-CD28-coupled beads. Cells were fixed and permeabilized. Total YB-1 and Ki-67 expression were analyzed by flow cytometry. Graph illustrates the average percentages of YB-1 or Ki-67-expressing CD4+ T cells of four different donors with mean value and S.E.M. (Student's t-test)

