Figure 2.
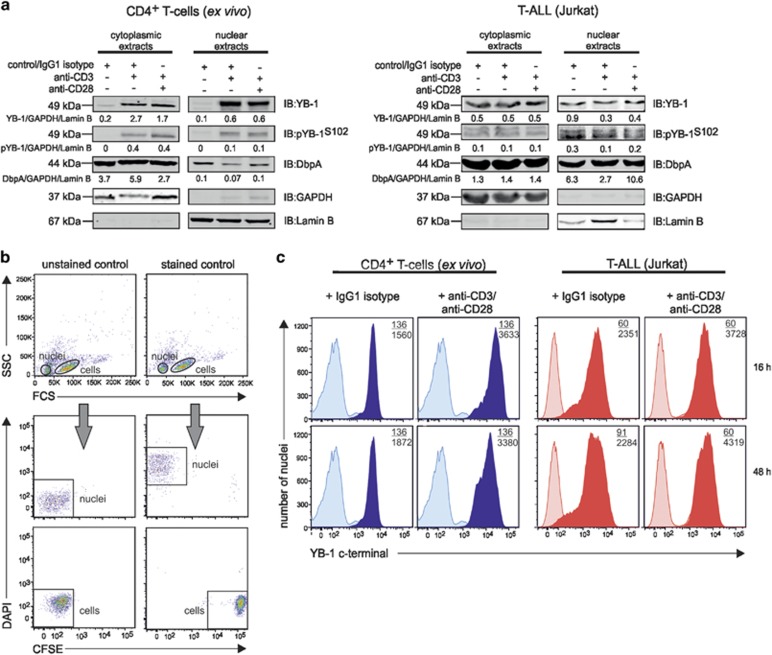
Subcellular localization of YB-1 in activated human CD4+ T cells and Jurkat cells. Activated primary human CD4+ T cells and Jurkat cells show cytoplasmic and nuclear YB-1 localization. (a) CD4+ T cells isolated from four different donors and Jurkat cells were stimulated either with anti-CD3/IgG1 isotype or anti-CD3/anti-CD28-coupled beads for 16 h. Subsequently, subcellular fractionation of cells was performed. CD4+ T-cell lysates of four different donors were pooled. Thirty micrograms of cytoplasmic and nuclear proteins were subjected to 12% SDS-PAGE, and western blotting analysis was performed using the indicated antibodies. GAPDH (glyceraldehyde 3-phosphate dehydrogenase; cytoplasm) and Lamin B (nucleus) were used for internal normalization and relative intensity is shown below each blot. Experiments were performed in triplicates, and one representative example is shown. (b) Establishing YB-1 detection in isolated nuclei of T cells by flow cytometry. CD4+ T cells labeled with carboxyfluorescein succinimidyl ester (CFSE) and isolated nuclei of CD4+ T cells marked with DAPI were mixed 1:1 and analyzed by flow cytometry. Left panels show the different distribution of the non-labeled cells and nuclei population; the right panels display the population of CFSE-labeled CD4+ T cells and DAPI-labeled nuclei. (c) Amounts of YB-1 in isolated nuclei of activated CD4+ T cells and Jurkat cells. T cells were stimulated either with IgG1 isotype or anti-CD3/anti-CD28-coupled beads for the indicated time periods. Nuclei were isolated, fixed, permeabilized, and incubated with primary anti-YB-1 C-terminal antibody and fluorescence-labeled secondary antibody. Numbers shown indicate the mean fluorescence intensity (MFI) of YB-1-positive nuclei of stimulated (number below) or unstimulated T cells (number on top). Experiments were performed in triplicates, and one representative example is shown

